Example 1
In this example, we will try to create a flowchart for the complete flow of patients in the SAFO study:
safo |>
  as_fc(label = "Patients assessed for eligibility") |>
  fc_filter(!is.na(group), label = "Randomized", show_exc = TRUE) |>
  fc_split(group) |>
  fc_filter(itt == "Yes", label = "Included in ITT") |>
  fc_filter(pp == "Yes", label = "Included in PP") |>
  fc_draw()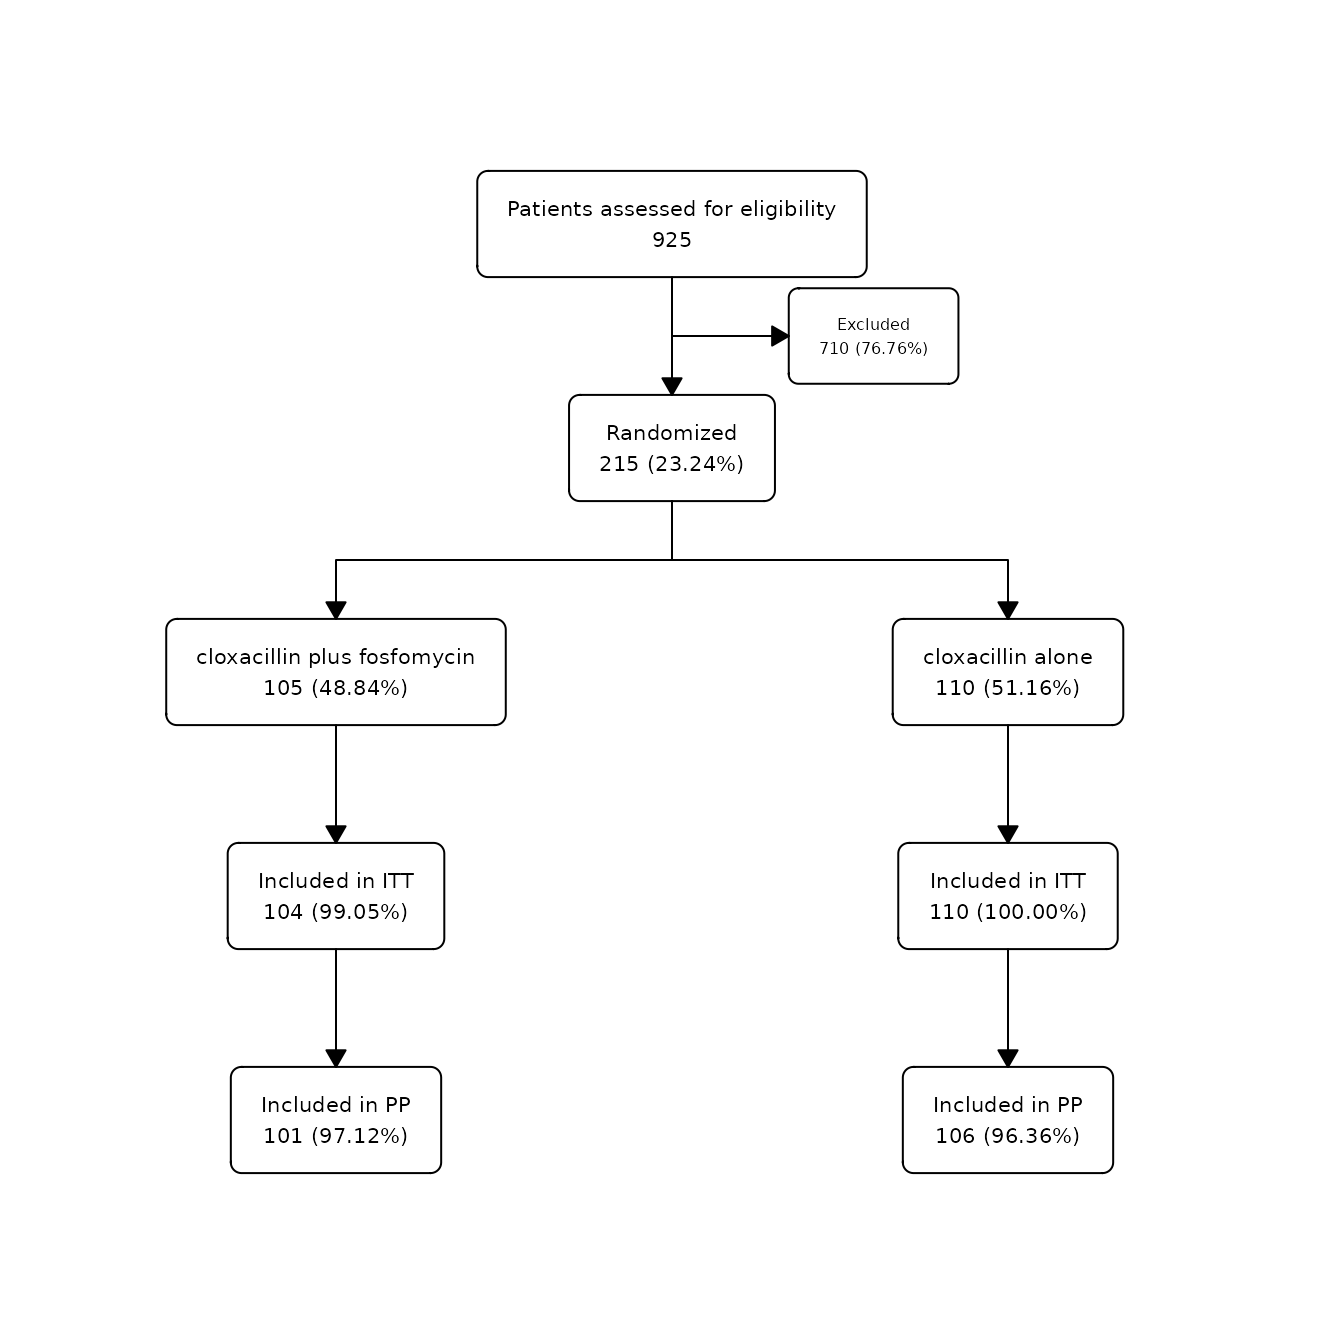
Example 2
In this example, we will try to exactly reproduce the original flowchart of the SAFO study published in Nature Medicine: SAFO flowchart.
First, we need to do some pre-processing to reproduce the text in the larger boxes:
# Create labels for exclusion box:
label_exc <- paste(
  c(str_glue("{sum(safo$inclusion_crit == 'Yes' | safo$exclusion_crit == 'Yes' | safo$decline_part == 'Yes', na.rm = T)} excluded:"),
    map_chr(c("inclusion_crit", "decline_part", "exclusion_crit"), ~str_glue("{sum(safo[[.x]] == 'Yes', na.rm = TRUE)} {attr(safo[[.x]], 'label')}")),
    map_chr(4:15, ~str_glue(" -  {sum(safo[[.x]] == 'Yes')} {attr(safo[[.x]], 'label')}"))),
  collapse = "\n")

label_exc <- gsub("exclusion criteria", "exclusion criteria:", label_exc)

safo1 <- safo |>
  filter(group == "cloxacillin plus fosfomycin", !is.na(reason_pp)) |>
  mutate(reason_pp = droplevels(reason_pp))

label_exc1 <- paste(
  c(str_glue("{nrow(safo1)} excluded:"),
    map_chr(levels(safo1$reason_pp), ~str_glue(" -  {sum(safo1$reason_pp == .x)} {.x}"))),
  collapse = "\n")

label_exc1 <- str_replace_all(label_exc1, c("nosocomial" = "nosocomial\n", "treatment" = "treatment\n"))

safo2 <- safo |>
  filter(group == "cloxacillin alone", !is.na(reason_pp)) |>
  mutate(reason_pp = droplevels(reason_pp))

label_exc2 <- paste(
  c(str_glue("{nrow(safo2)} excluded:"),
    map_chr(levels(safo2$reason_pp), ~str_glue(" -  {sum(safo2$reason_pp == .x)} {.x}"))),
  collapse = "\n")

label_exc2 <- str_replace_all(label_exc2, c("resistant" = "resistant\n", "blood" = "blood\n"))
Second, let’s create and customize the flowchart using the functions in the package:
safo |>
  as_fc(label = "patients assessed for eligibility", text_pattern = "{N} {label}") |>
  fc_filter(!is.na(group), label = "randomized", text_pattern = "{n} {label}", show_exc = TRUE, just_exc = "left", text_pattern_exc = "{label}", label_exc = label_exc, text_fs_exc = 7, offset_exc = 0.15) |>
  fc_split(group, text_pattern = "{n} asssigned\n {label}") |>
  fc_filter(itt == "Yes", label = "included in intention-to-treat\n population", show_exc = TRUE, text_pattern = "{n} {label}", label_exc = "patient did not receive allocated\n treatment (withdrew consent)", text_pattern_exc = "{n} {label}", text_fs_exc = 7) |>
  fc_filter(pp == "Yes", label = "included in per-protocol\n population", show_exc = TRUE, just_exc = "left", text_pattern = "{n} {label}", text_fs_exc = 7) |>
  fc_modify(
    ~.x |>
      filter(n != 0) |>
      mutate(
        text = case_when(id == 11 ~ label_exc1, id == 13 ~ label_exc2, TRUE ~ text)
      )
  ) |>
  fc_draw()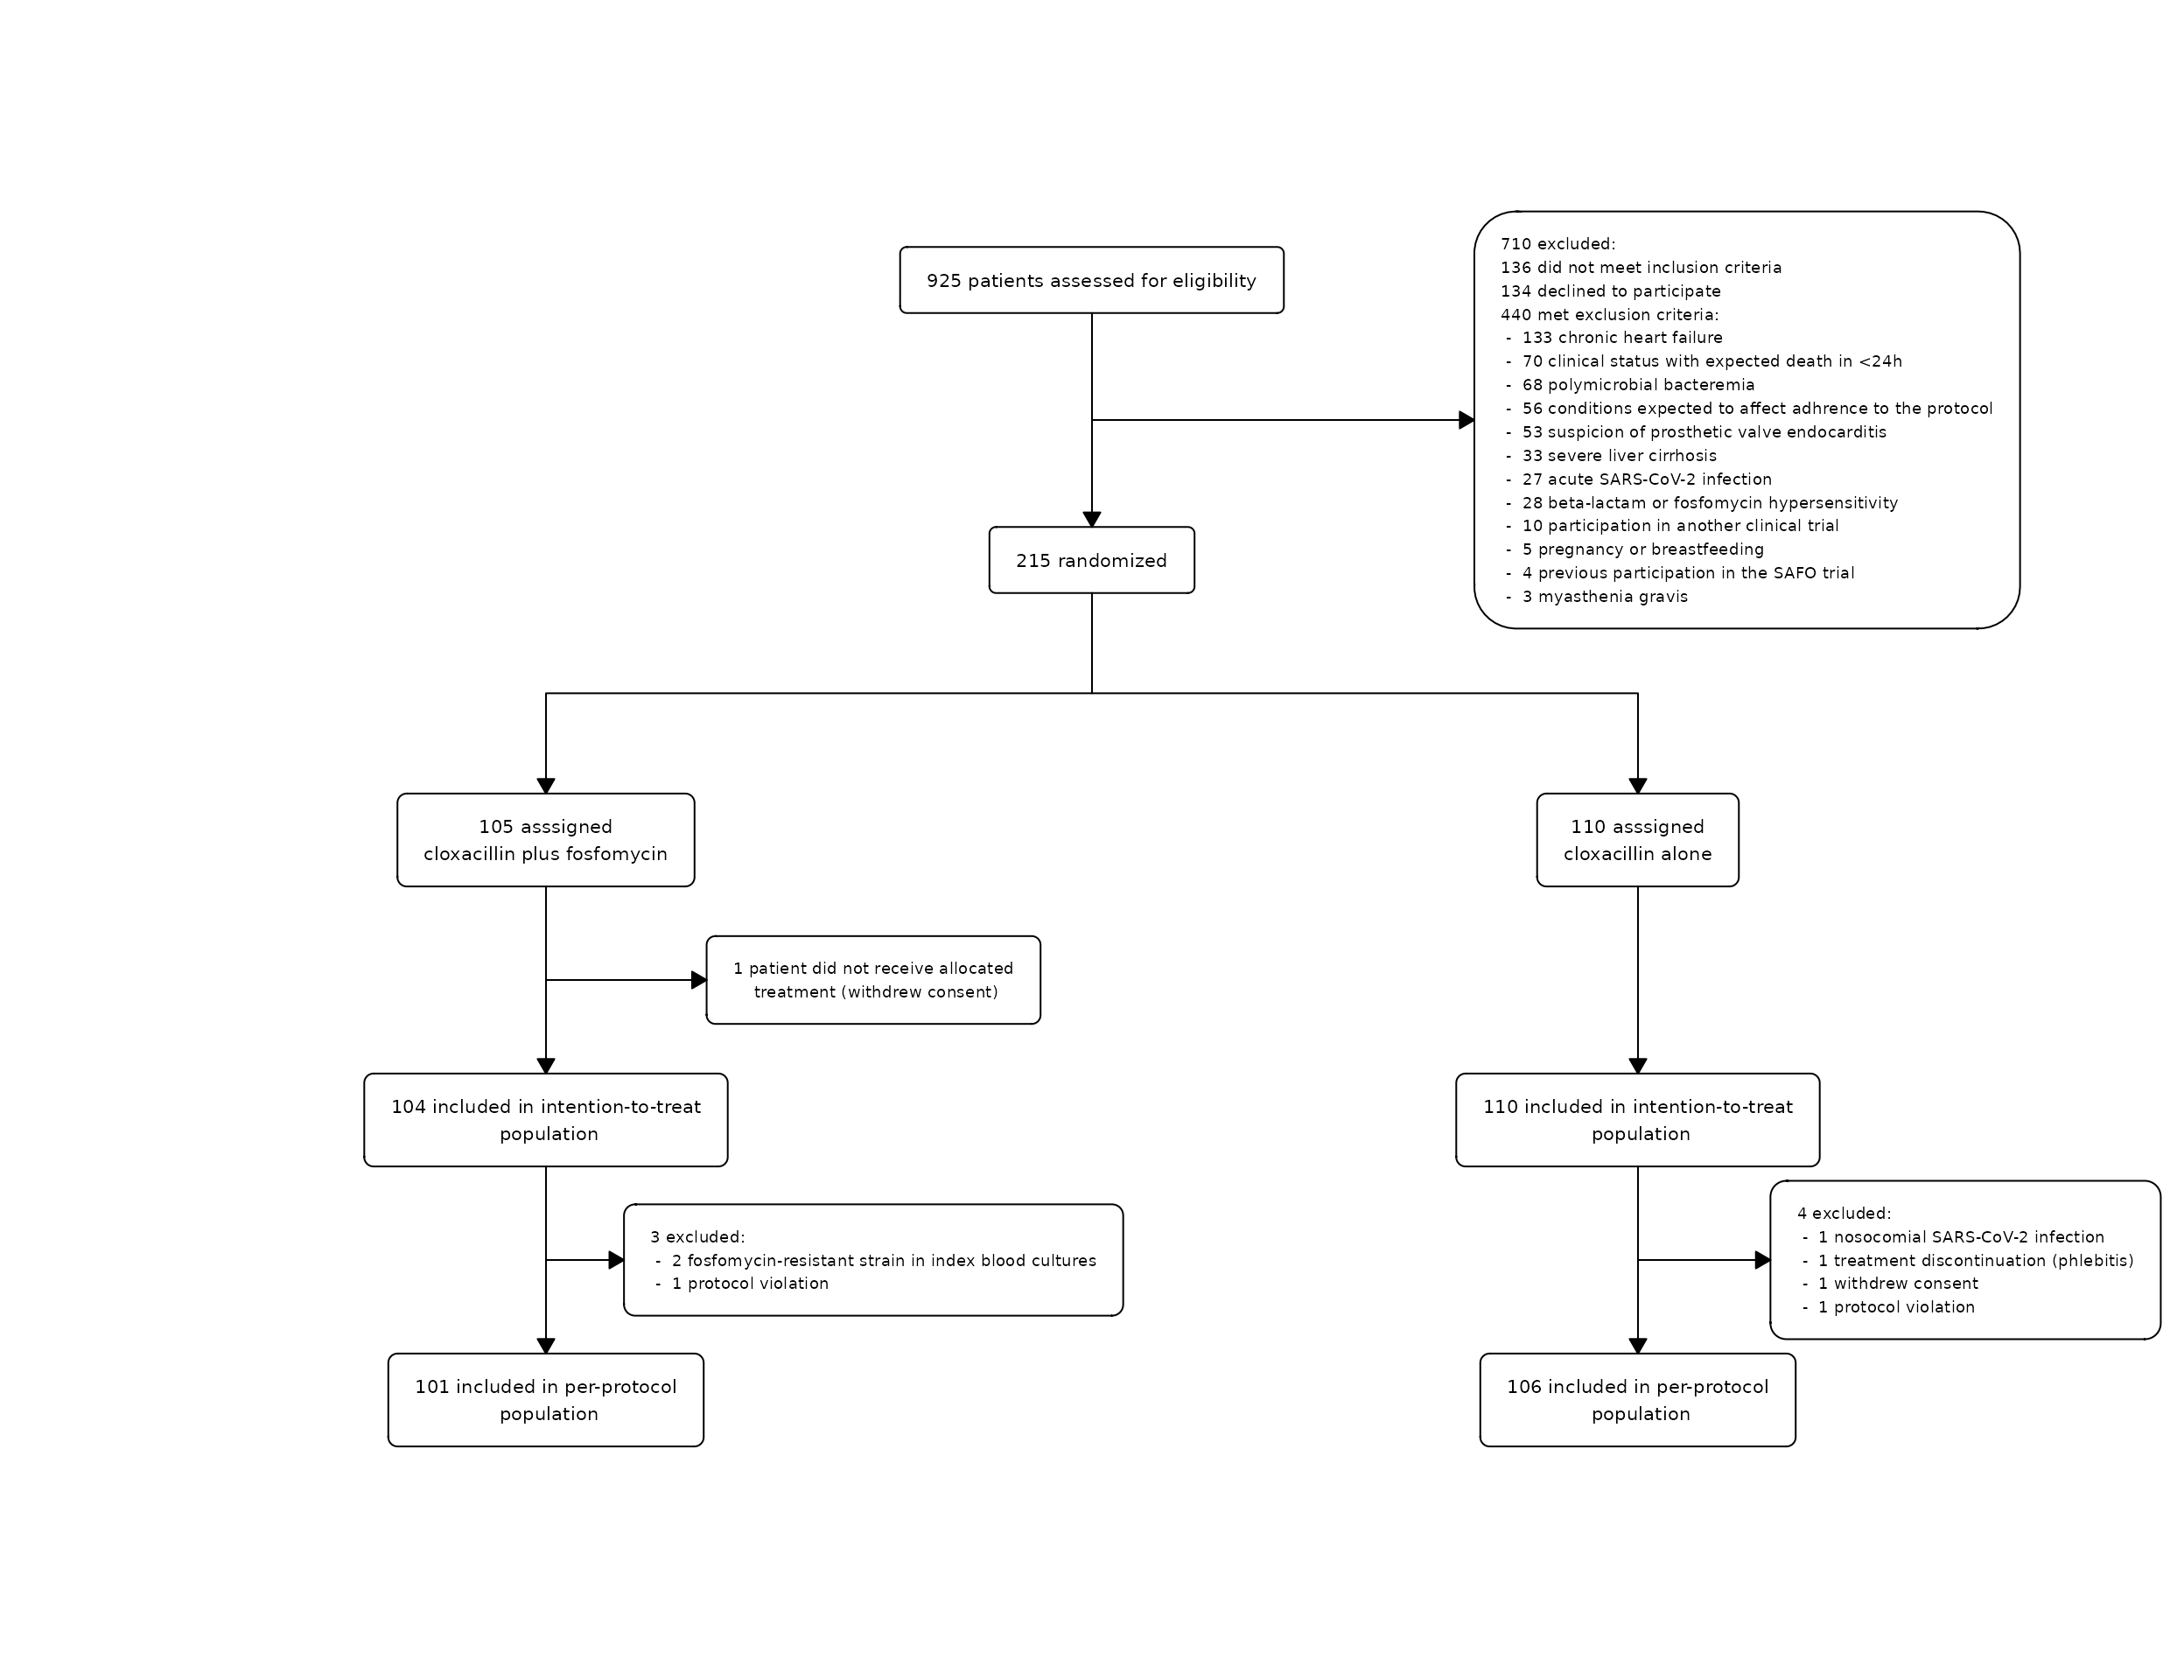
Example 3
In this example, we will create a flowchart without any
data.frame, using the N argument to manually
specify the numbers to display in the boxes:
as_fc(N = 300) |>
  fc_filter(N = 240, label = "Randomized patients", show_exc = TRUE) |>
  fc_split(N = c(100, 80, 60), label = c("Group A", "Group B", "Group C")) |>
  fc_filter(N = c(80, 75, 50), label = "Finished the study") |>
  fc_draw()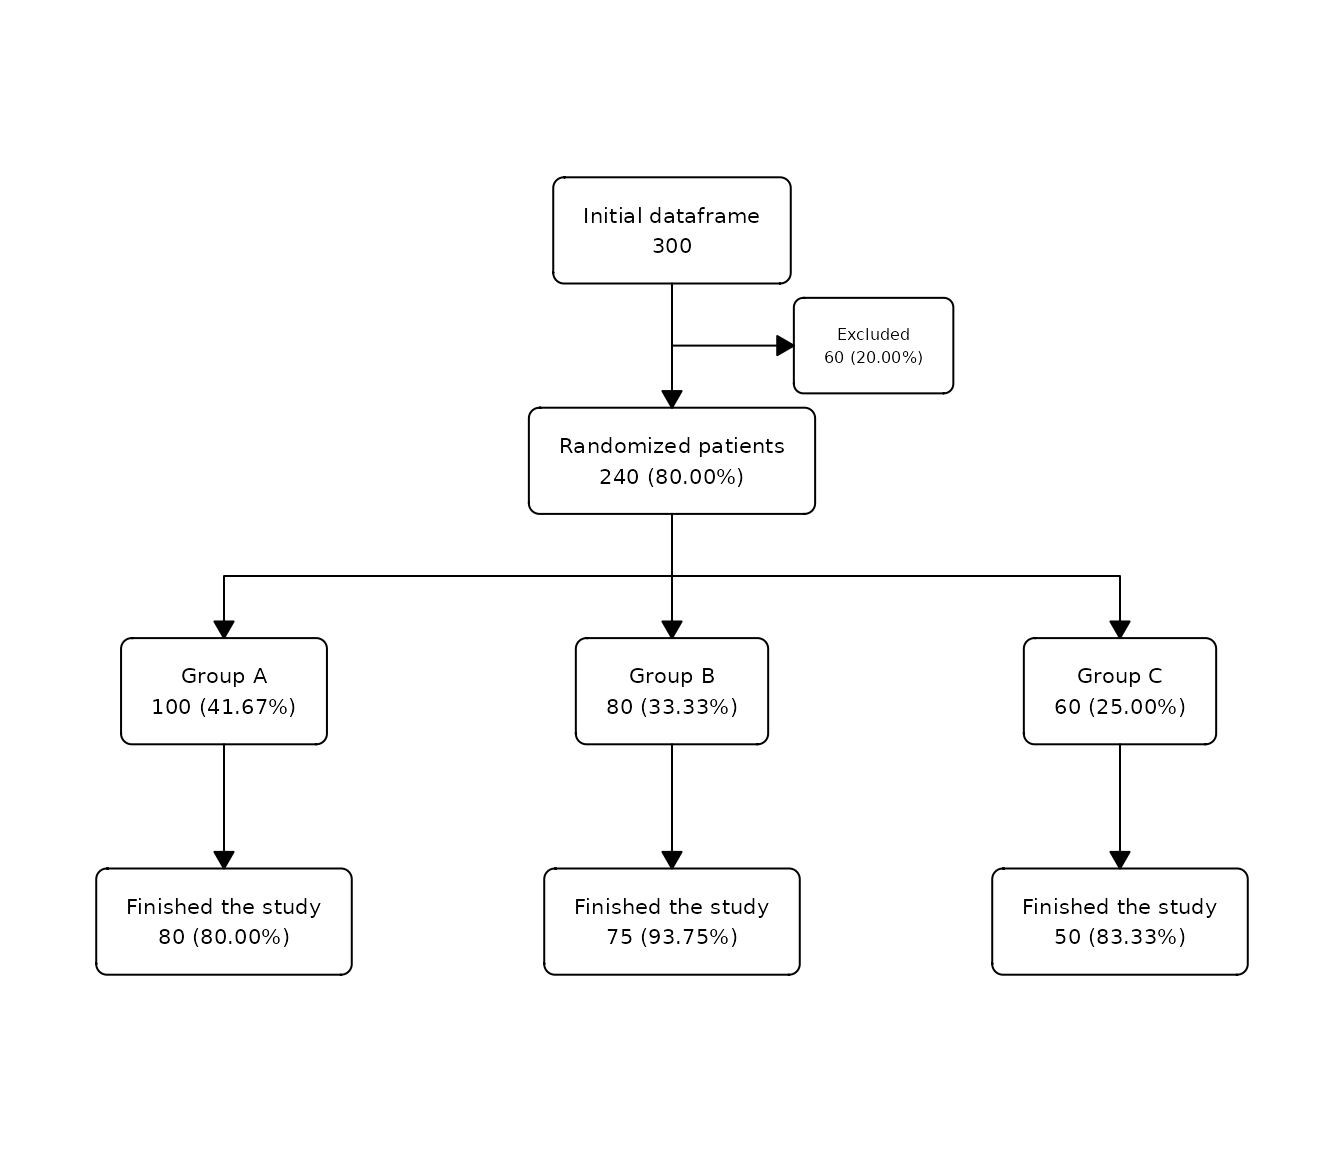
Example 4
The use of N= argument can be combined with the use of a
data.frame. In this example, we will use the
N= argument in a flowchart that uses a
data.frame:
safo |>
  as_fc(label = "Patients assessed for eligibility") |>
  fc_filter(!is.na(group), label = "Randomized", show_exc = TRUE) |>
  fc_split(group) |>
  fc_split(N = c(50, 55, 10, 100), label = c("Group A", "Group B")) |>
  fc_draw()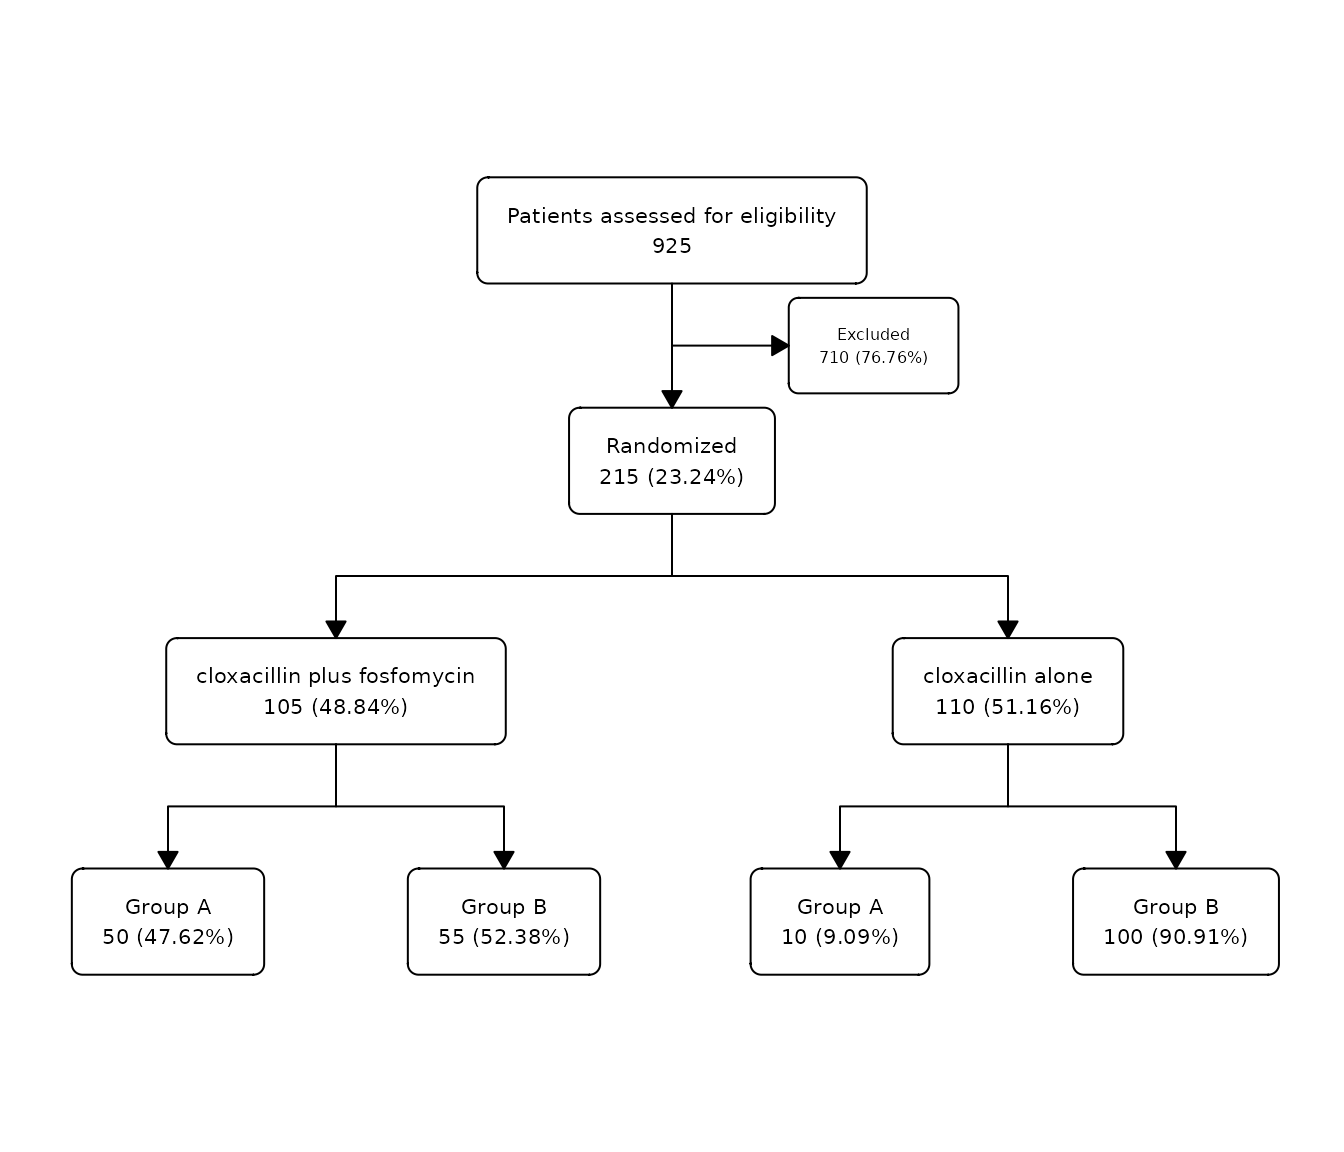
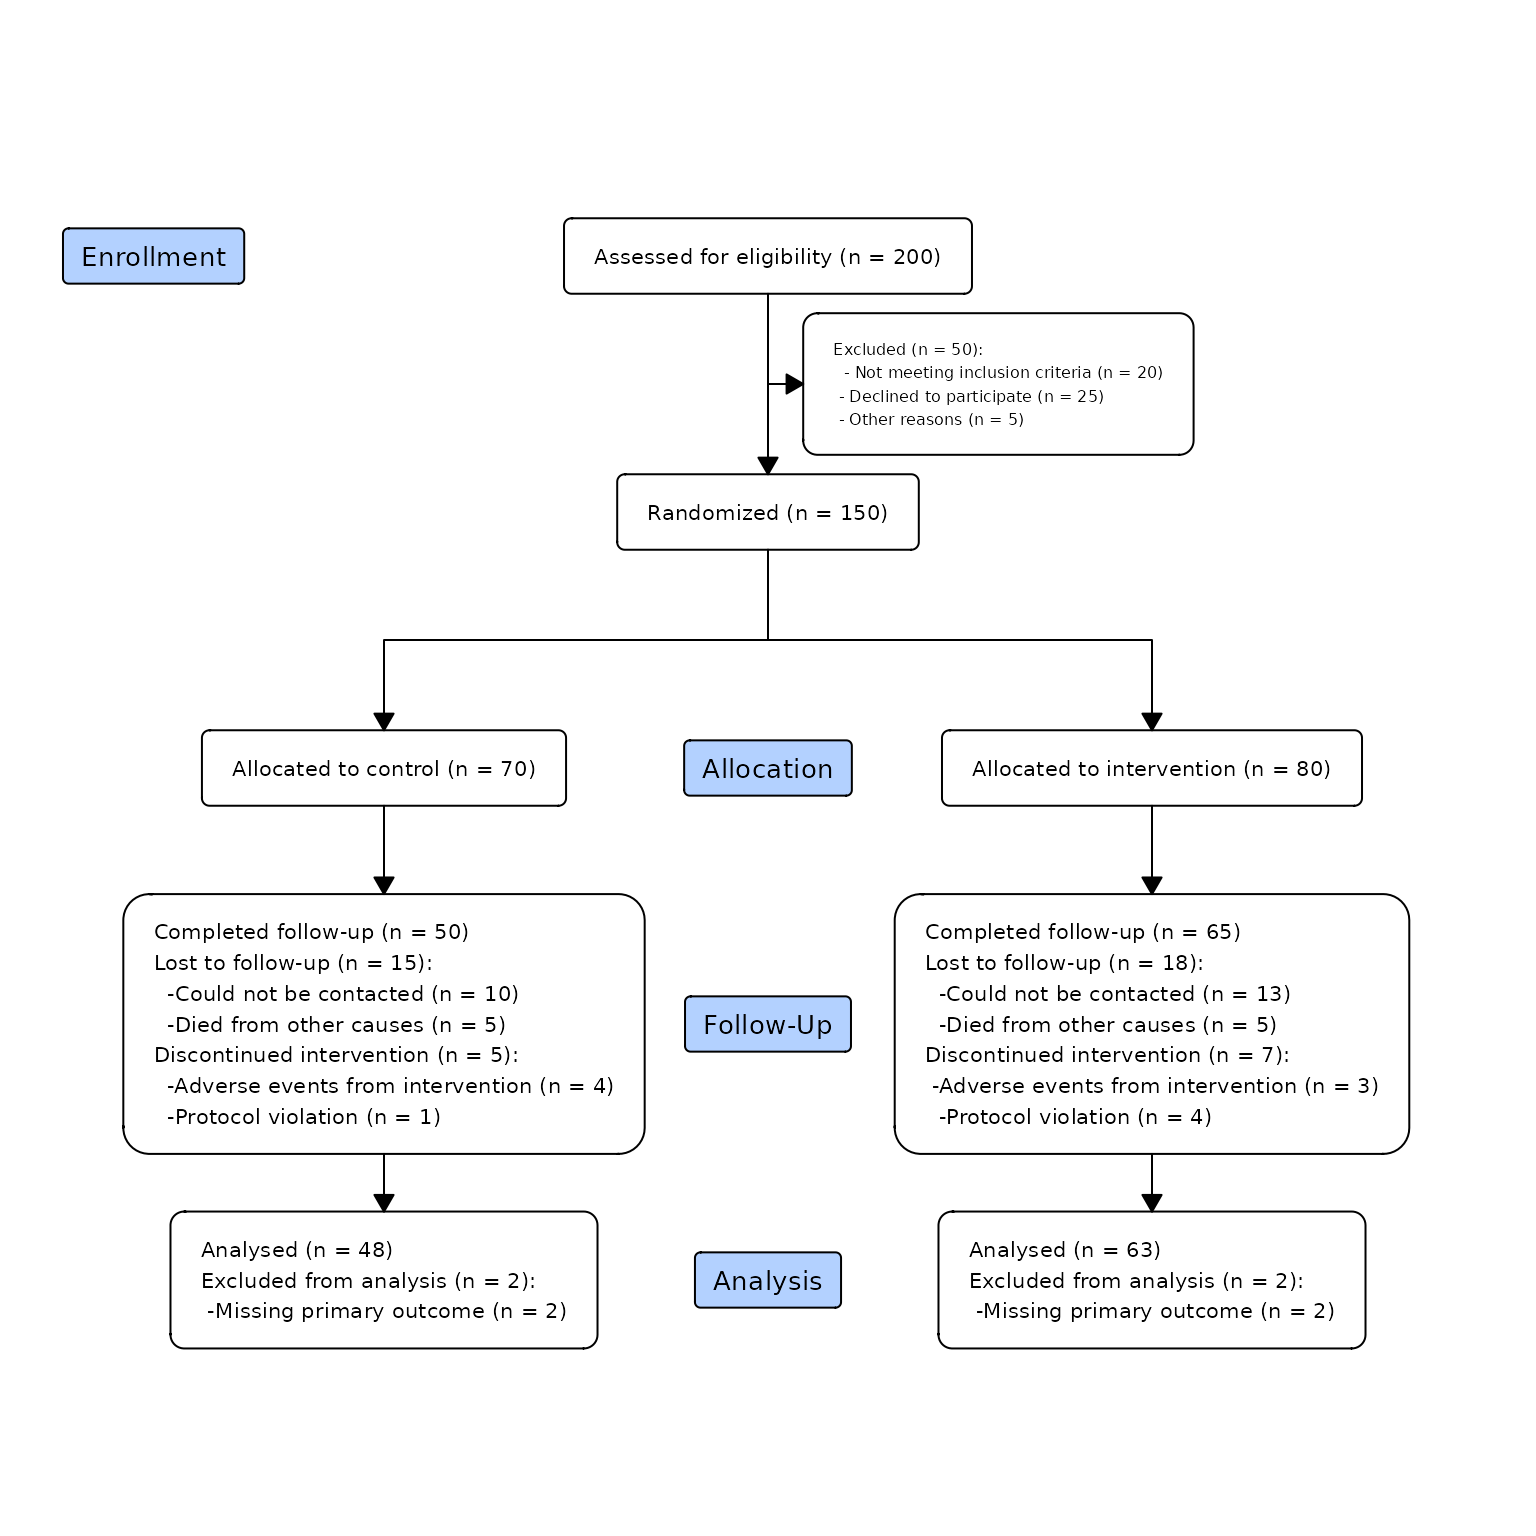
Example 5
In this example, we will attempt to recreate the flowchart suggested by the CONSORT guideline:
as_fc(N = 200, label = "Assessed for eligibility", title = "Enrollment") |>
  fc_filter(N = 150, label = "Randomized", show_exc = TRUE, just_exc = "left") |>
  fc_split(N = c(70, 80), label = c("Allocated to control", "Allocated to intervention"), title = "Allocation", x_title = 0.5) |>
  fc_filter(N = c(50, 65), label = "Completed follow-up", title = "Follow-Up", just = "left", x_title = 0.5) |>
  fc_filter(N = c(48, 63), label = "Analysed", title = "Analysis", just = "left", x_title = 0.5) |>
  fc_theme(text_pattern = "{label} (n = {n})", text_pattern_init = "{label} (n = {n})", text_pattern_exc = "{label} (n = {n}):") |>
  fc_modify(
    ~ . |>
      mutate(
        text = case_when(
          id == 4 ~ paste0(text, "\n  - Not meeting inclusion criteria (n = 20)\n - Declined to participate (n = 25)\n - Other reasons (n = 5)"),
          id == 8 ~ paste0(text, "\nLost to follow-up (n = 15):\n  -Could not be contacted (n = 10)\n  -Died from other causes (n = 5)\nDiscontinued intervention (n = 5):\n  -Adverse events from intervention (n = 4)\n  -Protocol violation (n = 1)"),
          id == 9 ~ paste0(text, "\nLost to follow-up (n = 18):\n  -Could not be contacted (n = 13)\n  -Died from other causes (n = 5)\nDiscontinued intervention (n = 7):\n -Adverse events from intervention (n = 3)\n  -Protocol violation (n = 4)"),
          id == 11 ~ paste0(text, "\nExcluded from analysis (n = 2):\n -Missing primary outcome (n = 2)"),
          id == 12 ~ paste0(text, "\nExcluded from analysis (n = 2):\n -Missing primary outcome (n = 2)"),
          .default = text
        )
      )
  ) |>
  fc_draw()