Flowchart Customization
Source:vignettes/articles/flowchart-customization.Rmd
flowchart-customization.RmdWe can customize the flowchart either with the arguments provided by
each function in the process of creating it, or directly in the final
output using the fc_theme() or fc_modify()
functions.
Change function arguments
There are many different arguments in as_fc(),
fc_filter(), fc_split(), and
fc_draw() that allow you to customize the boxes created at
each step. See the documentation for these functions for more
information. Some examples of how to use these arguments are given at
the end of the vignette: Customization
examples.
Functions to customize the flowchart
fc_theme()
We can use fc_theme() to set all parameters for all
boxes in a flowchart at once. This is useful if we want to apply the
same style to all the boxes. For example, let’s customize the following
flowchart:
safo |>
  dplyr::filter(!is.na(group)) |>
  as_fc(label = "Randomized patients") |>
  fc_split(group) |>
  fc_draw()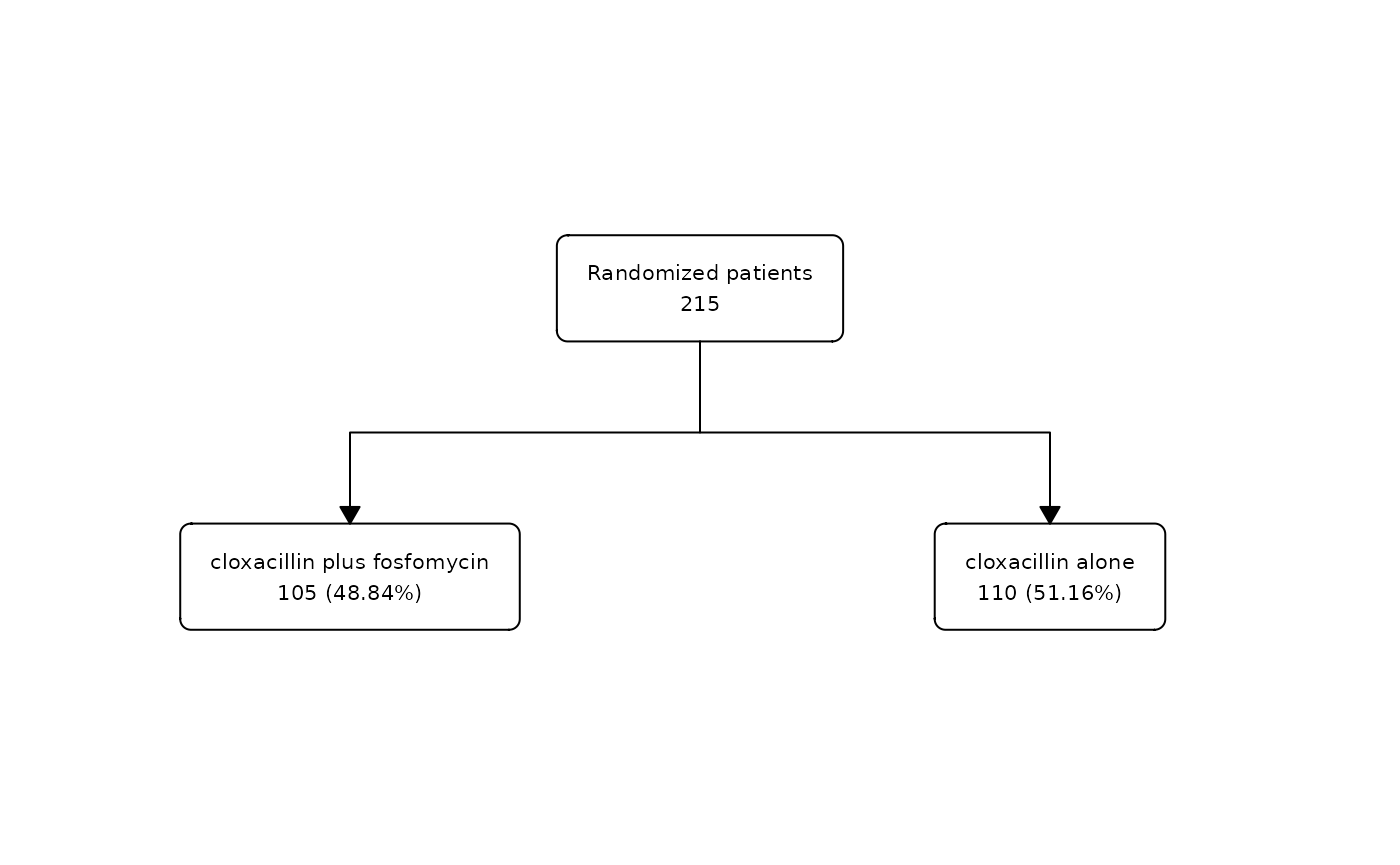
Let’s change the style of all the boxes:
safo |>
  dplyr::filter(!is.na(group)) |>
  as_fc(label = "Randomized patients") |>
  fc_split(group) |>
  fc_theme(text_pattern_init = "{label}, {n}", text_pattern = "{label}, {n}/{N}", text_fs = 11, text_color = "#324C54", text_fface = 2, bg_fill = "#ADD8E6") |>
  fc_draw()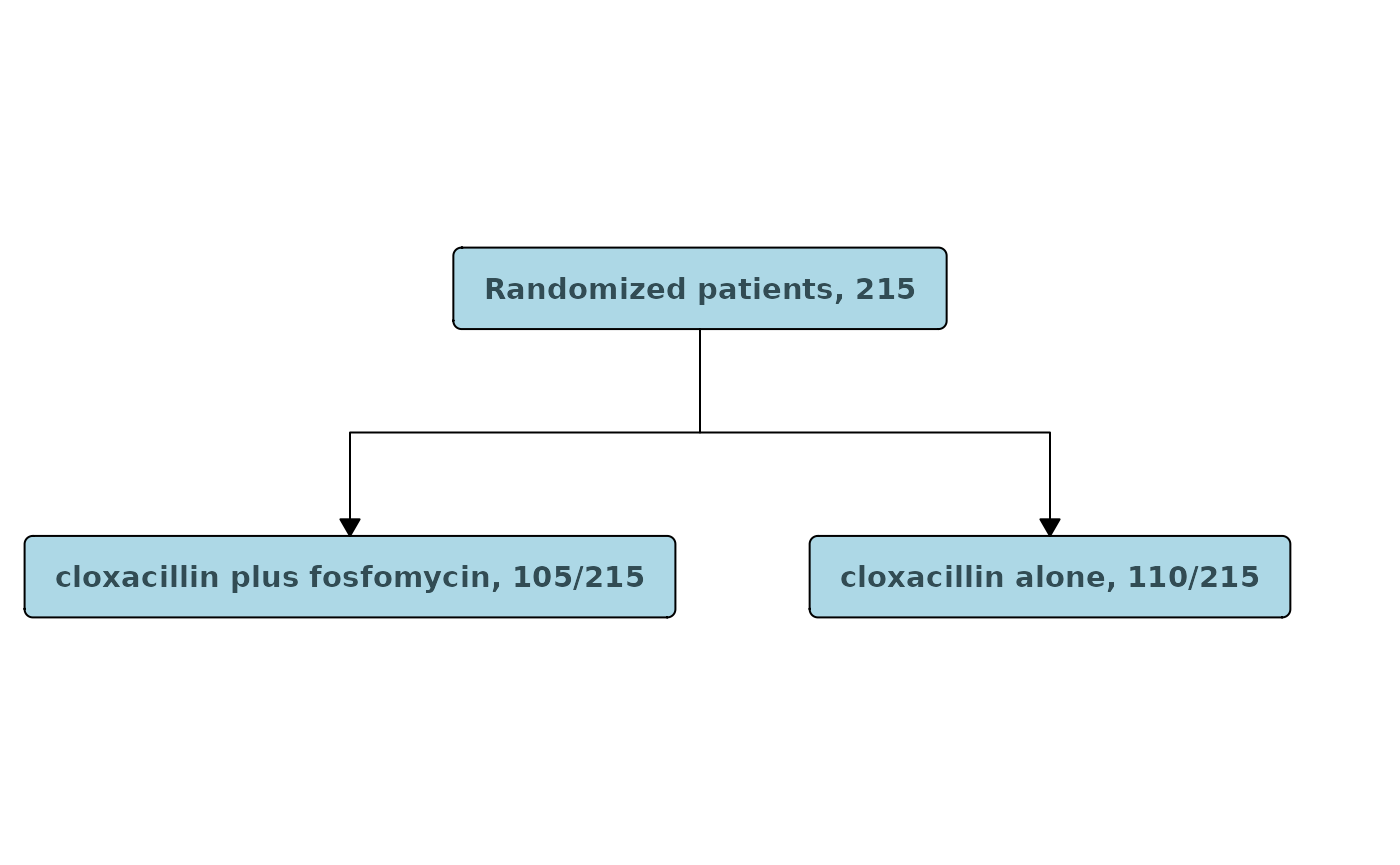
fc_modify()
The function fc_modify allows the user to customise the
created flowchart by modifying its parameters, which are stored in
.$fc.
For example, let’s customize the following flowchart:
safo_fc <- safo |>
  as_fc(label = "Patients assessed for eligibility") |>
  fc_filter(!is.na(group), label = "Randomized", show_exc = TRUE)

safo_fc |>
  fc_draw()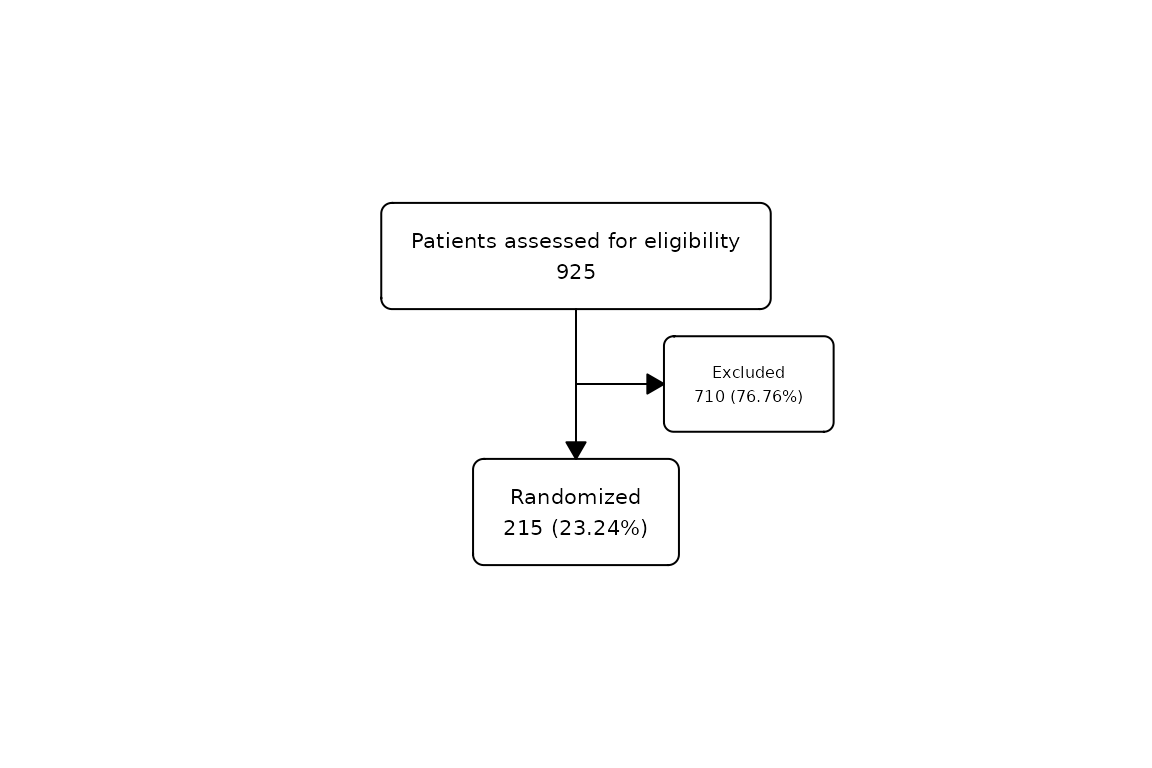
Previous to modifying it, we can use the function fc_view() to inspect the element $fc that we want to change:
safo_fc |>
  fc_view("fc")
## # A tibble: 3 × 22
## id x y n N perc label text_pattern text type group just
## <int> <dbl> <dbl> <int> <int> <chr> <chr> <chr> <chr> <chr> <lgl> <chr>
## 1 1 0.5 0.667 925 925 100 Pati… "{label}\n{… "Pat… init NA cent…
## 2 2 0.5 0.333 215 925 23.24 Rand… "{label}\n … "Ran… filt… NA cent…
## 3 3 0.65 0.5 710 925 76.76 Excl… "{label}\n … "Exc… excl… NA cent…
## # ℹ 10 more variables: text_color <chr>, text_fs <dbl>, text_fface <dbl>,
## # text_ffamily <lgl>, text_padding <dbl>, bg_fill <chr>, border_color <chr>,
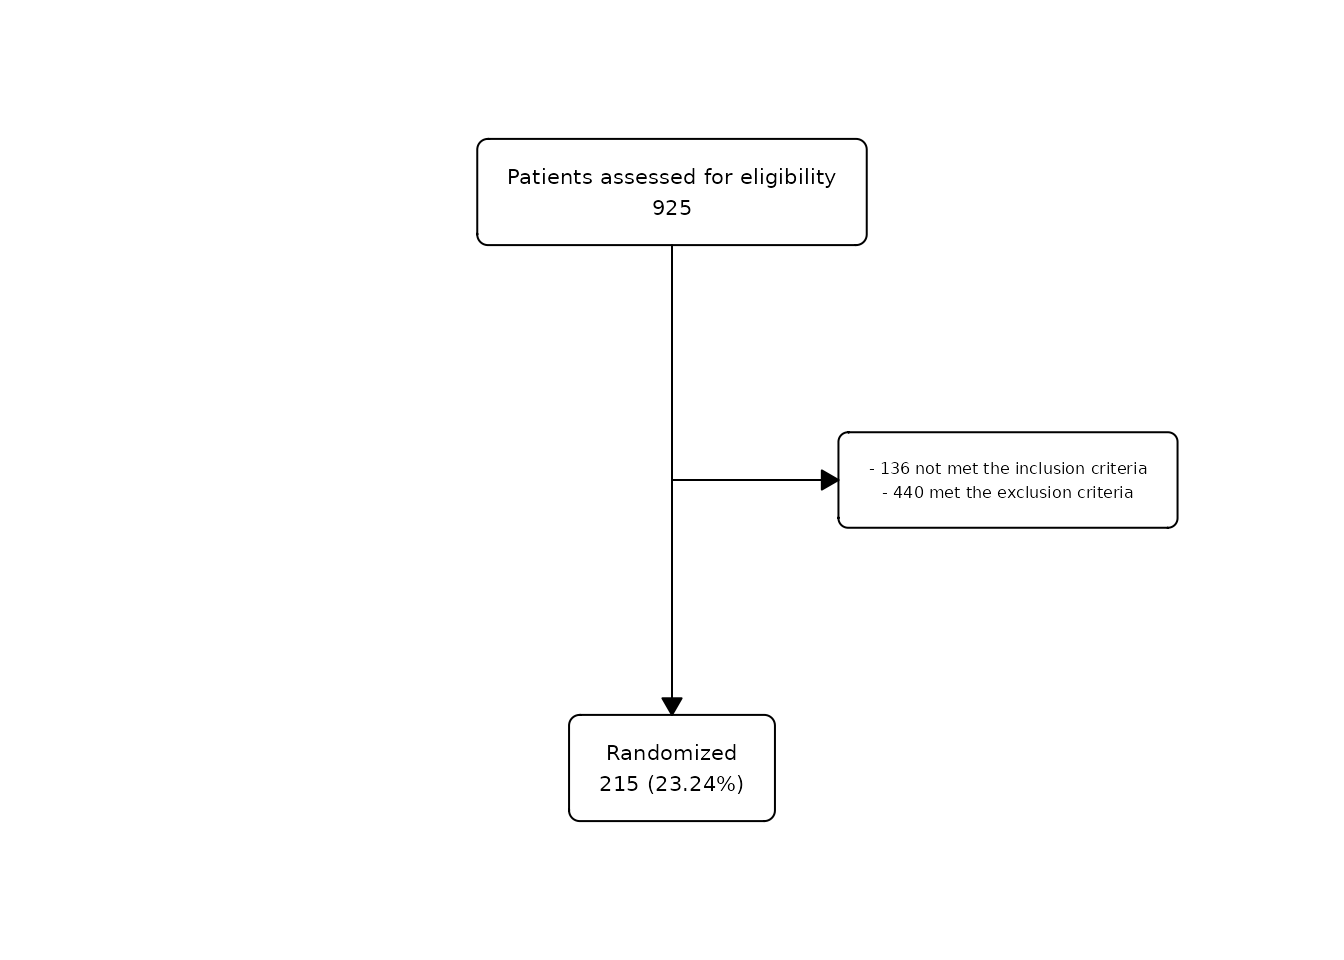
## # width <lgl>, height <lgl>, end <lgl>Let’s customise the text in the exclusion box (id = 3) to specify different reasons for exclusion, and change the x and y coordinate:
safo_fc |>
  fc_modify(
    ~ . |>
      mutate(
        text = ifelse(id == 3, str_glue("- {sum(safo$inclusion_crit == 'Yes')} not met the inclusion criteria\n- {sum(safo$exclusion_crit == 'Yes')} met the exclusion criteria"), text),
        x = case_when(
          id == 3 ~ 0.75,
          TRUE ~ x
        ),
        y = case_when(
          id == 1 ~ 0.8,
          id == 2 ~ 0.2,
          TRUE ~ y
        )
      )
  ) |>
  fc_draw()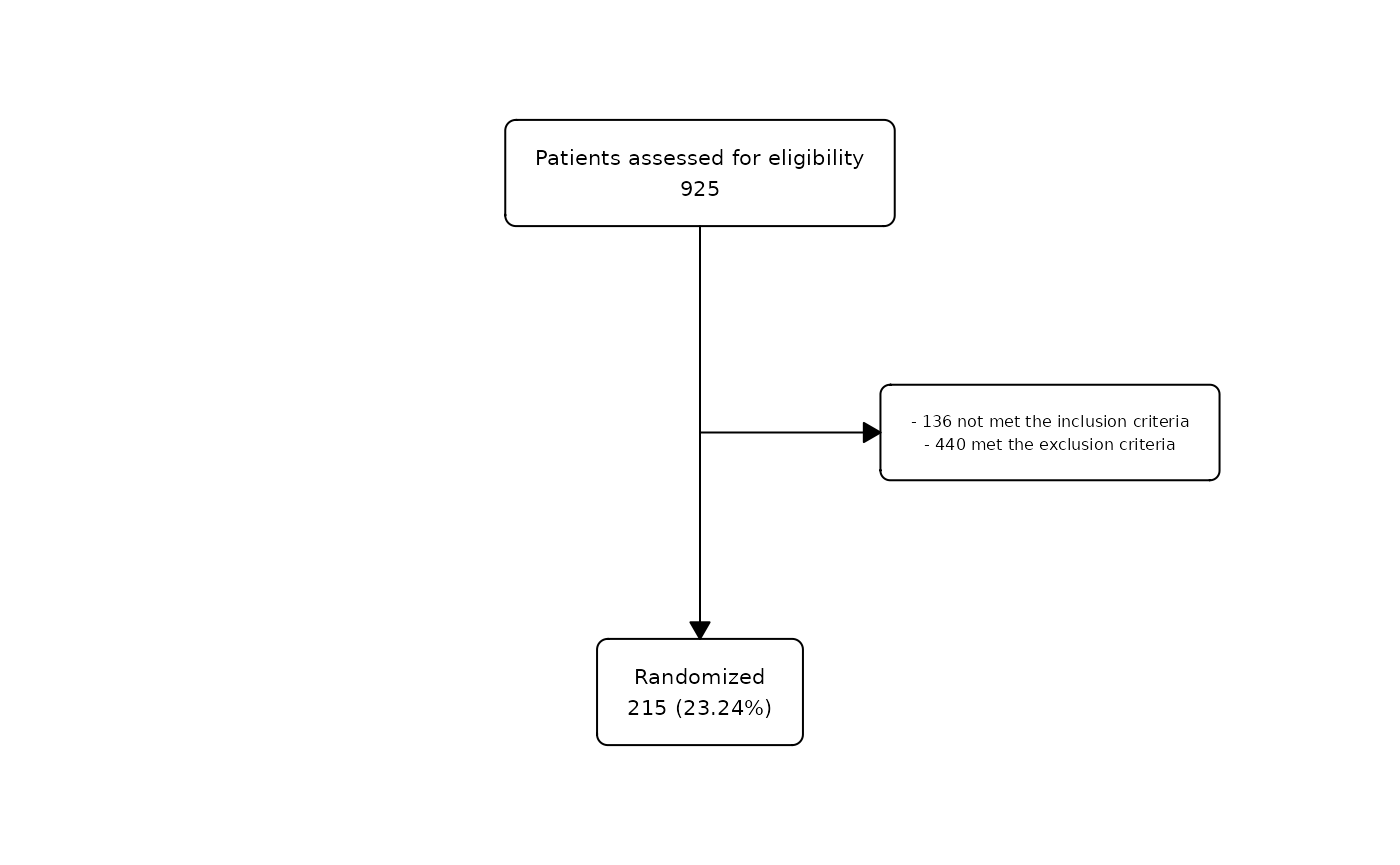
Customization examples
In these examples, we will explore some of the arguments to customize the following flowchart:
safo |>
  as_fc(label = "Patients assessed for eligibility") |>
  fc_filter(!is.na(group), label = "Randomized", show_exc = TRUE) |>
  fc_split(group) |>
  fc_draw()
Change the flowchart appearance
You can set the background color of each box using
bg_fill=:
safo |>
  as_fc(label = "Patients assessed for eligibility", width = 0.6, text_fs = 10, text_fface = 2, text_ffamily = "serif", text_padding = 2, bg_fill = "lightgrey") |>
  fc_filter(!is.na(group), label = "Randomized", show_exc = TRUE, text_color = "white", bg_fill = "darkgreen", text_color_exc = "white", bg_fill_exc = "firebrick") |>
  fc_split(group, bg_fill = c("darkblue", "purple"), text_color = "white") |>
  fc_modify(
    ~ . |>
      mutate(
        y = case_when(
          type == "init" ~ 0.8,
          .default = y
        )
      )
  ) |>
  fc_draw()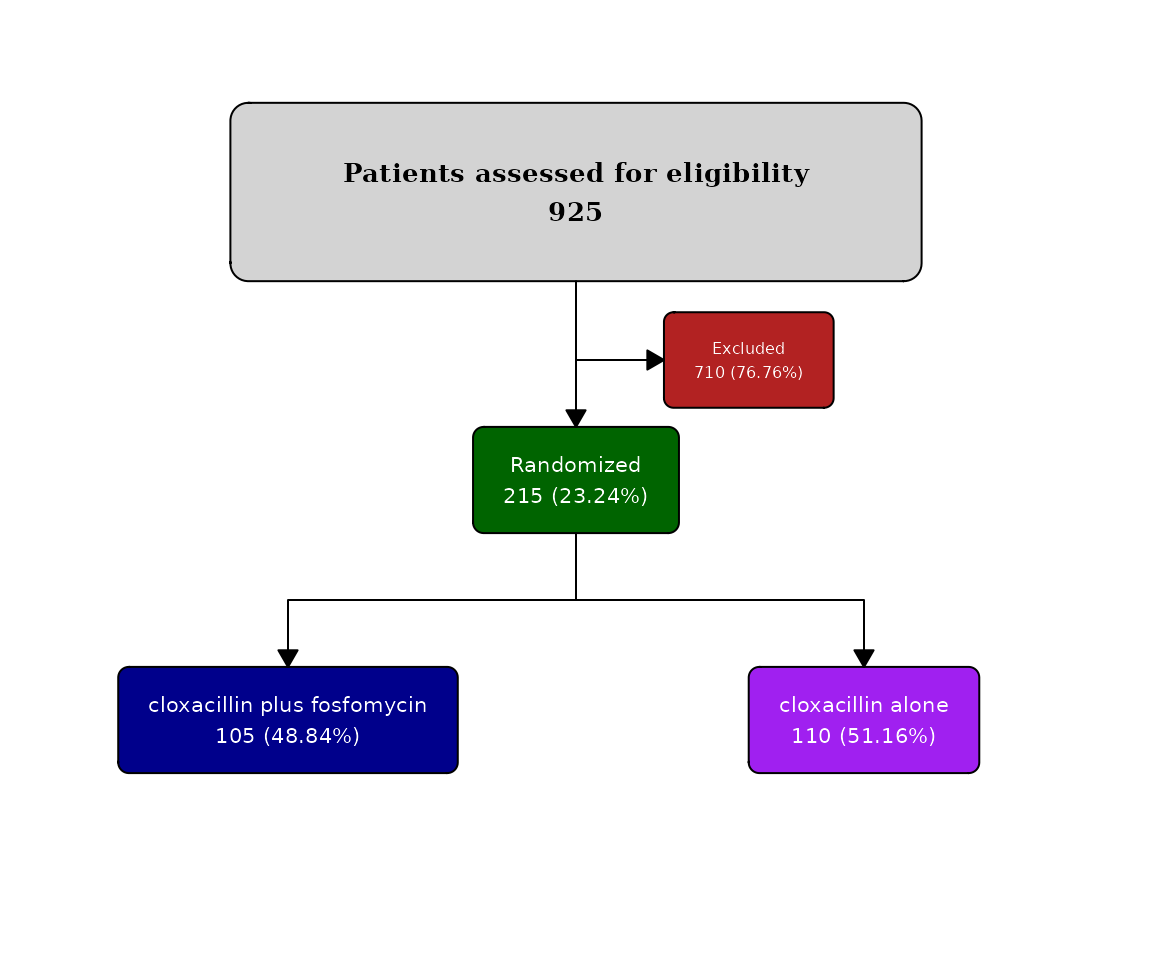
You can also alter the background of the canvas behind the flowchart
boxes using the bg_canvas= argument in
fc_draw:
safo |>
  as_fc(label = "Patients assessed for eligibility", width = 0.6, text_fs = 10, text_fface = 2, text_ffamily = "serif", text_padding = 2, bg_fill = "lightgrey") |>
  fc_filter(!is.na(group), label = "Randomized", show_exc = TRUE, text_color = "white", bg_fill = "darkgreen", text_color_exc = "white", bg_fill_exc = "firebrick") |>
  fc_split(group, bg_fill = c("darkblue", "purple"), text_color = "white") |>
  fc_modify(
    ~ . |>
      mutate(
        y = case_when(
          type == "init" ~ 0.8,
          .default = y
        )
      )
  ) |>
  fc_draw(canvas_bg = "darkgrey")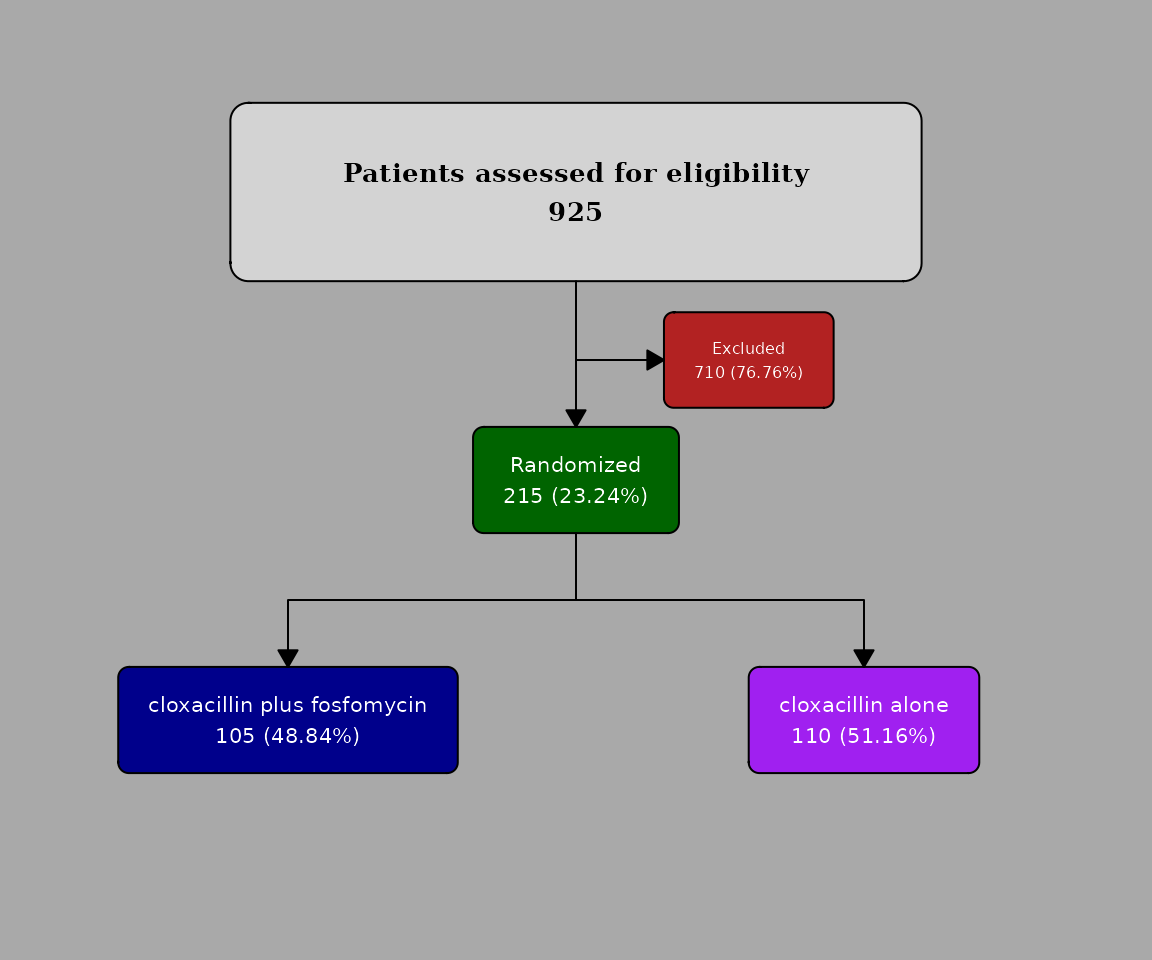
Add a title to the flowchart
We can add a title to the flowchart using the argument
title= in the fc_draw() function:
safo |>
  as_fc(label = "Patients assessed for eligibility") |>
  fc_filter(!is.na(group), label = "Randomized", show_exc = TRUE) |>
  fc_split(group) |>
  fc_draw(title = "SAFO flowchart")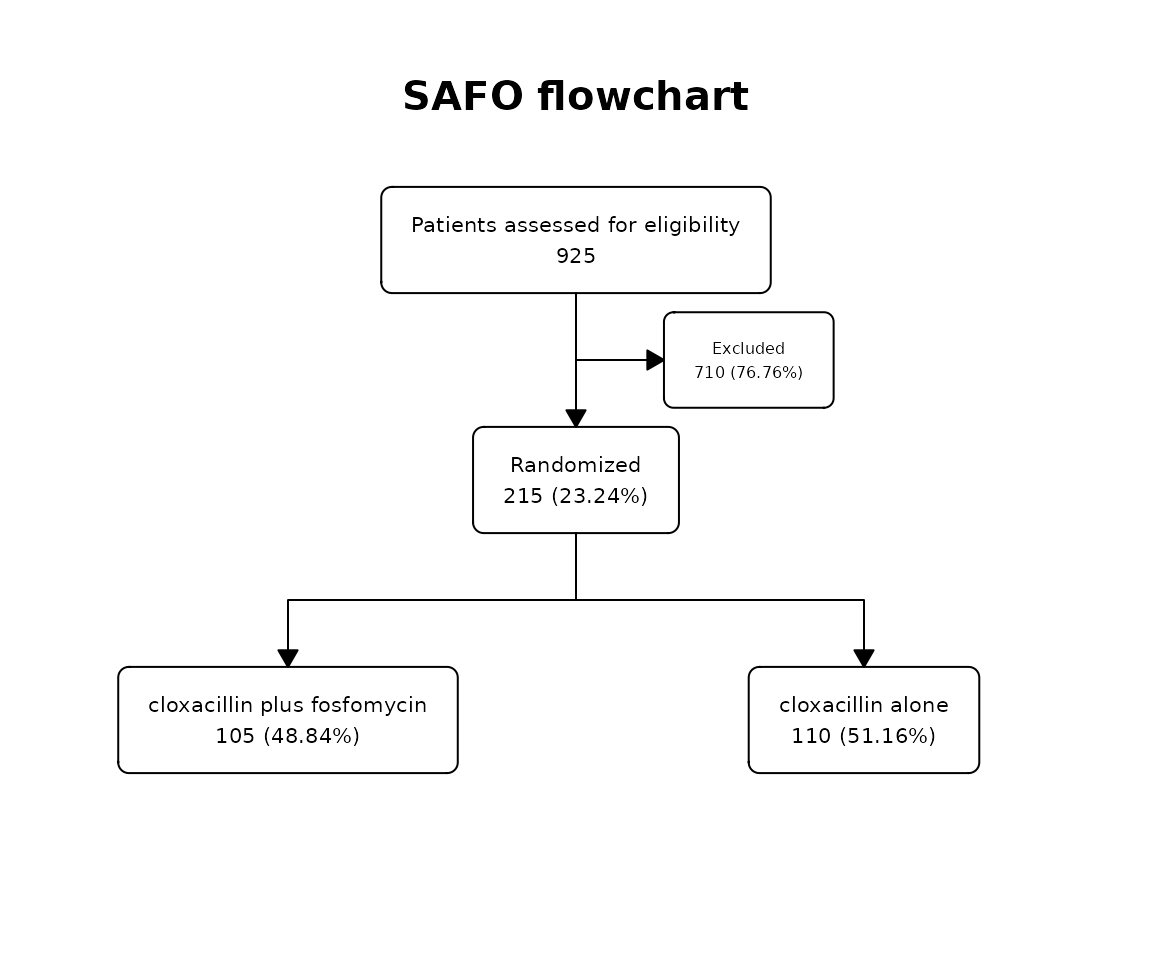
Add titles in each step
We can also add titles to each step of a flowchart to create CONSORT-style
flow diagrams. The argument title must be used in the
as_fc(), fc_filter() or
fc_split() functions:
as_fc(N = 100, label = "Assessed for eligibility", title = "Enrollment") |>
  fc_filter(N = 80, label = "Randomized") |>
  fc_split(N = c(40, 40), label = c("Allocated to control", "Allocated to intervention"), title = "Allocation") |>
  fc_filter(N = c(31, 34), label = "Lost to follow-up", title = "Follow-up") |>
  fc_filter(N = c(30, 32), label = "Analyzed", title = "Analysis") |>
  fc_draw()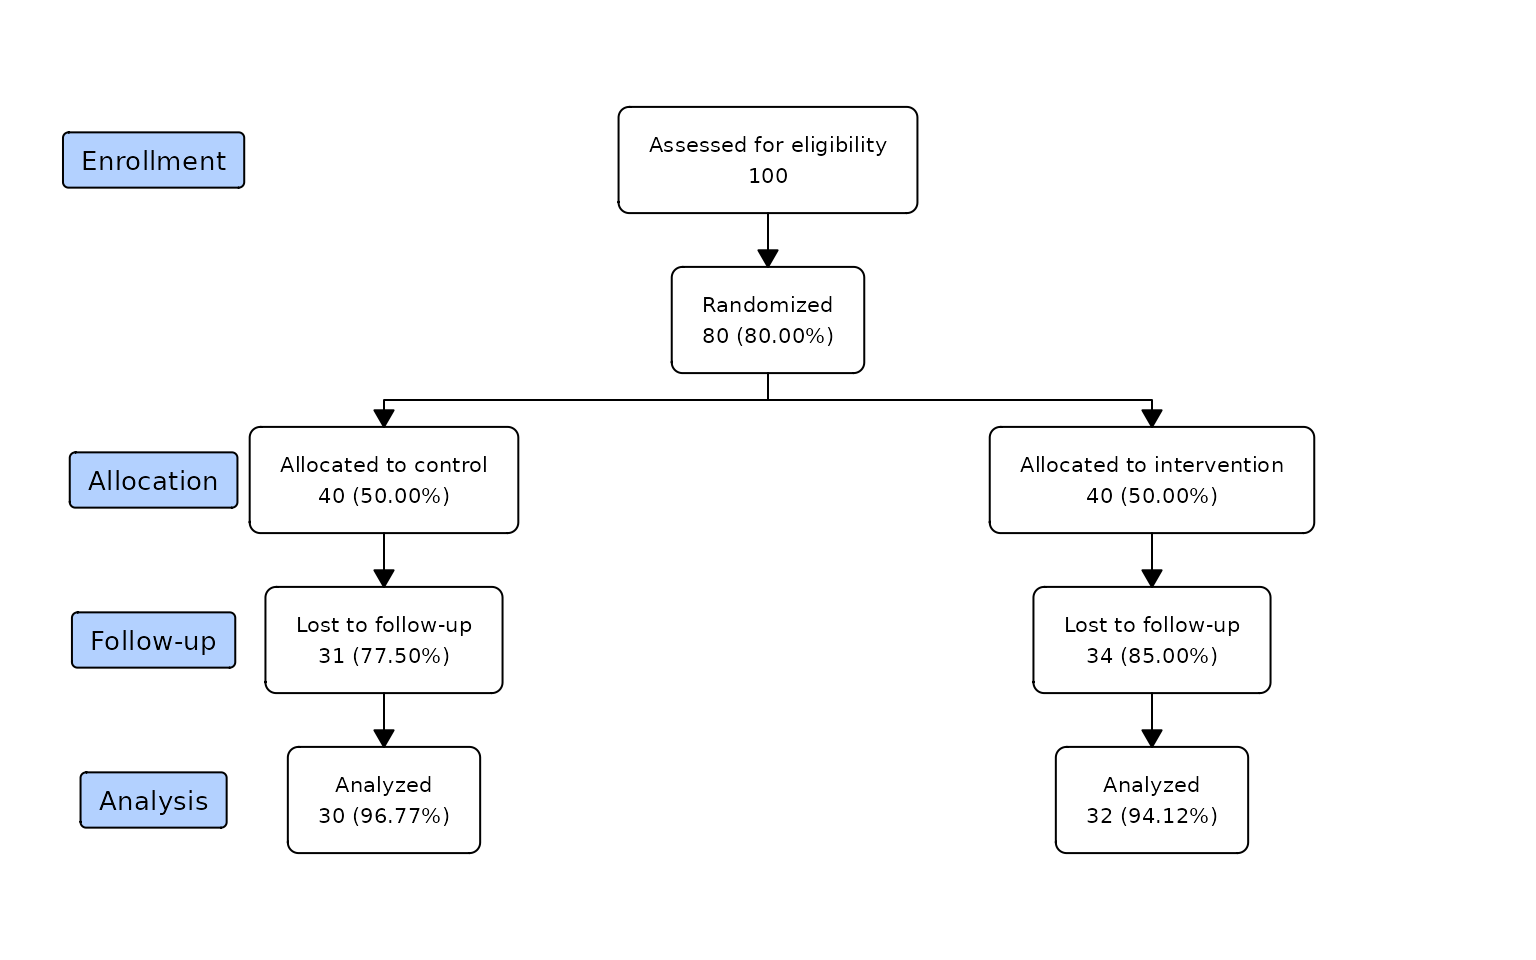
Percentage with respect to the total rows
We can change the calculation of all percentages in a
flowchart. By default, percentages are calculated with
respect to the box in the previous level. With the argument
perc_total= we can change it, to calculate it with respect
to the initial box with the total number of rows:
safo |>
  as_fc(label = "Patients assessed for eligibility") |>
  fc_filter(!is.na(group), label = "Randomized", show_exc = TRUE, perc_total = TRUE) |>
  fc_split(group, perc_total = TRUE) |>
  fc_draw()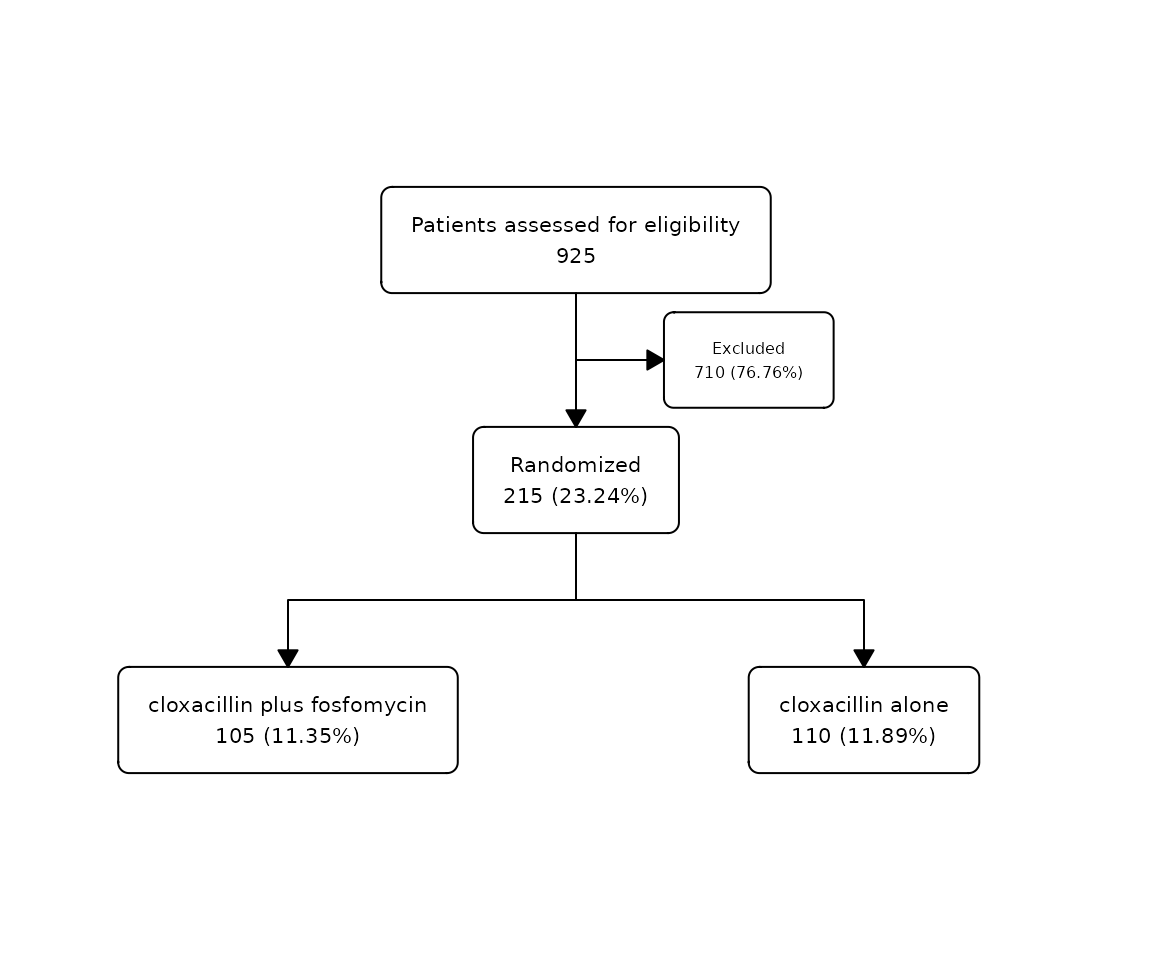
Offset
We can add/remove space to the distance between boxes in a split
using the argument offset:
safo |>
  as_fc(label = "Patients assessed for eligibility") |>
  fc_filter(!is.na(group), label = "Randomized", show_exc = TRUE, perc_total = TRUE) |>
  fc_split(group, offset = 0.1) |>
  fc_draw()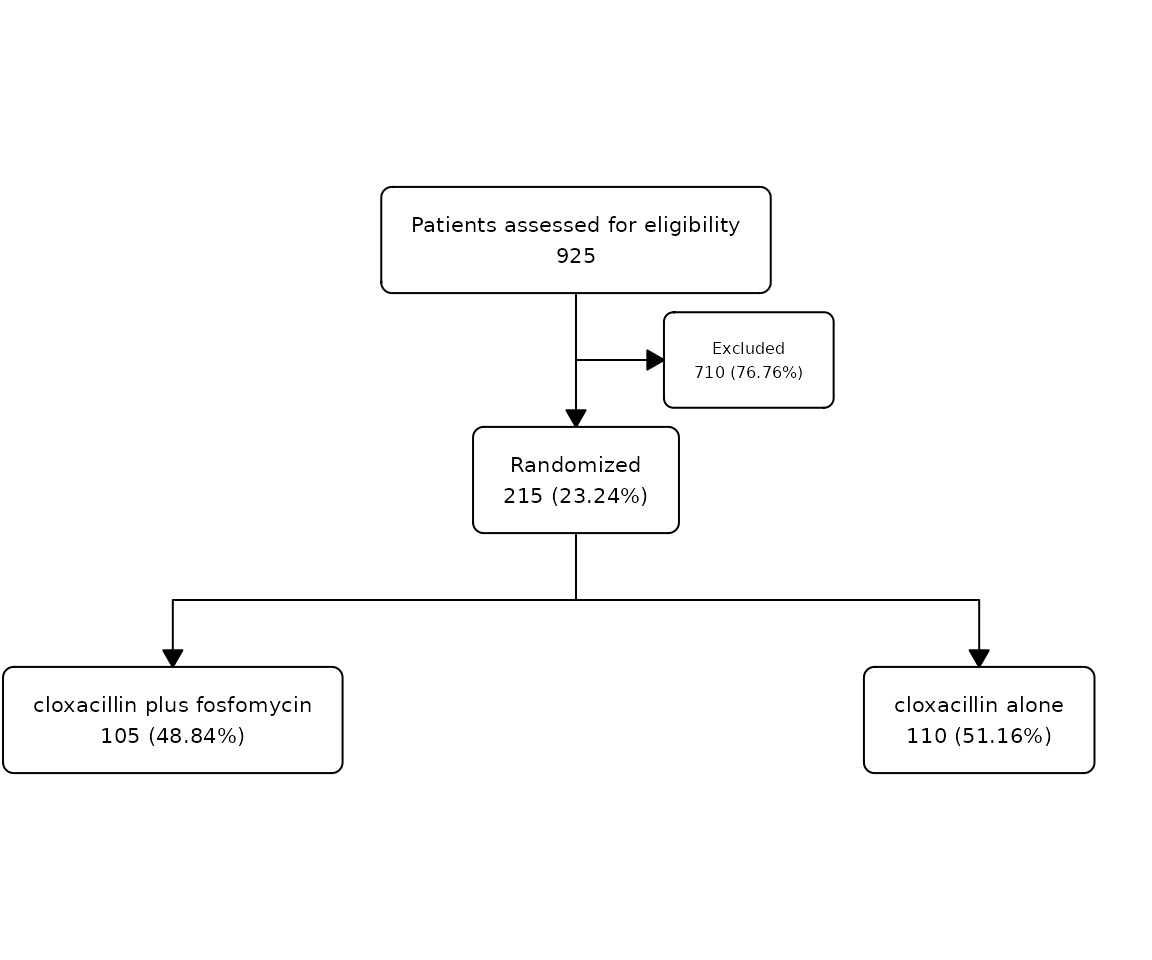
safo |>
  as_fc(label = "Patients assessed for eligibility") |>
  fc_filter(!is.na(group), label = "Randomized", show_exc = TRUE, perc_total = TRUE) |>
  fc_split(group, offset = -0.1) |>
  fc_draw()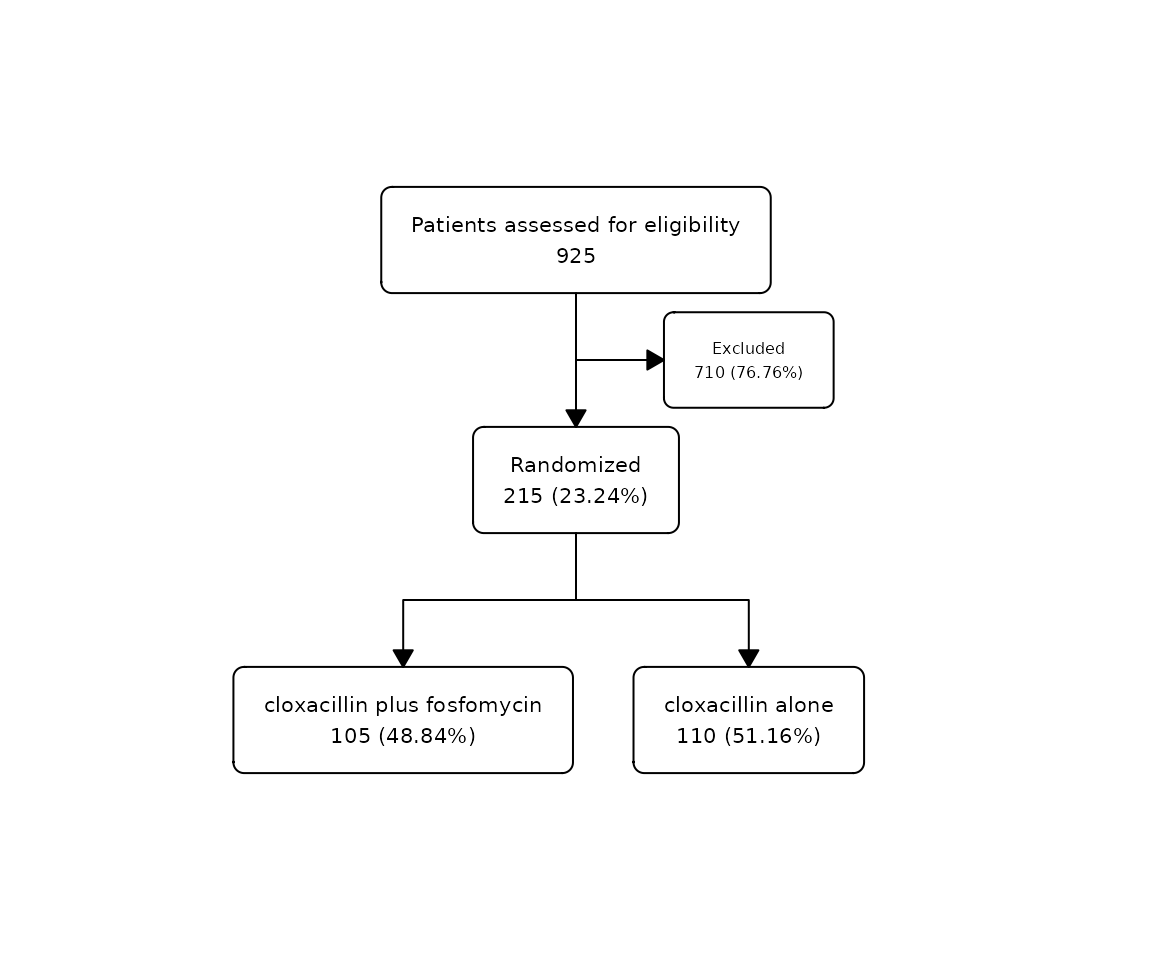
We can also add/remove space to the distance between the excluded box
in a filter using the argument offset_exc:
safo |>
  as_fc(label = "Patients assessed for eligibility") |>
  fc_filter(!is.na(group), label = "Randomized", show_exc = TRUE, offset_exc = 0.1) |>
  fc_split(group) |>
  fc_draw()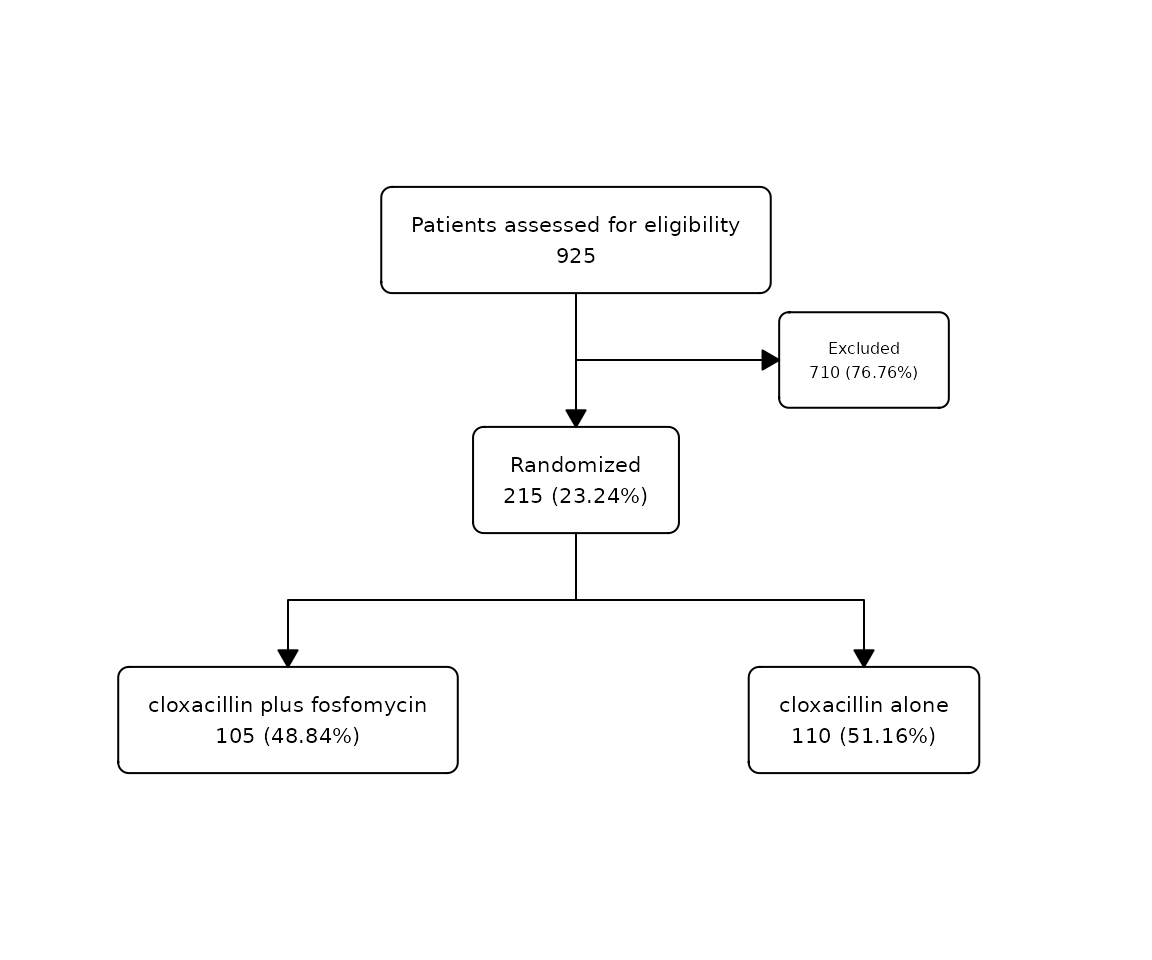
Change Box Corner Style
We can change the corner style of the flowchart boxes using the
box_corners argument with fc_draw:
safo |>
  as_fc(label = "Patients assessed for eligibility") |>
  fc_filter(!is.na(group), label = "Randomized", show_exc = TRUE) |>
  fc_split(group) |>
  fc_draw(box_corners = "sharp")
Use expressions
We can use expressions in the label or the text pattern of each box. Expressions allow you to use bold or italic text without having to change the font of all the box text.
For example, let’s put and expression in the label:
safo |>
  as_fc(label = expression(paste("Patients ", italic("assessed"), " for ", bold("eligibility")))) |>
  fc_draw()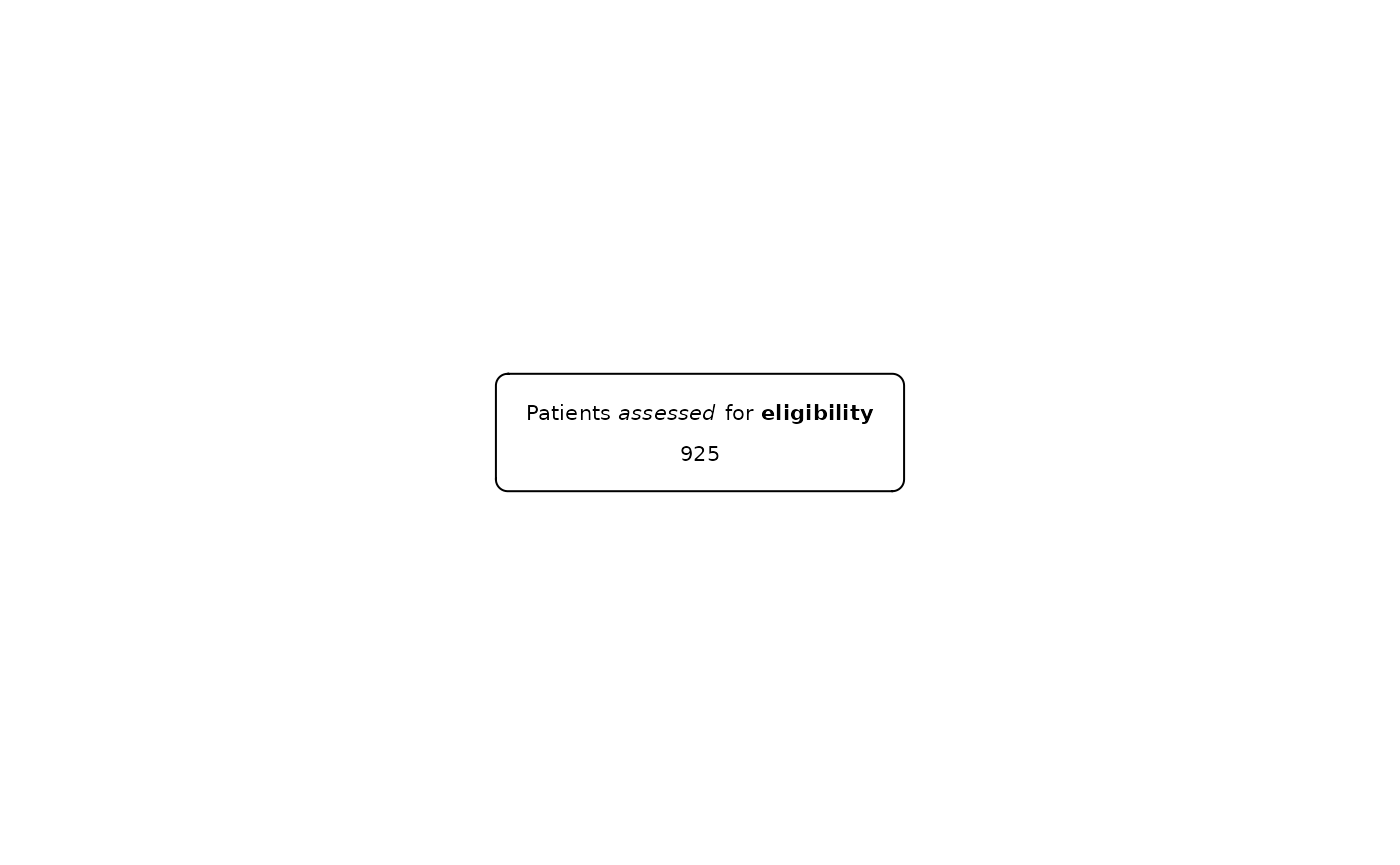
Now, let’s use it also in the text pattern of the box:
safo |>
  as_fc(label = expression(paste("Patients ", italic("assessed"), " for ", bold("eligibility"))), text_pattern = expression(paste("{label}", bold("{n}")))) |>
  fc_filter(filter = chronic_heart_failure == "No",
            label = expression(paste(italic("No chronic"), bold(" heart failure"))),
            label_exc = expression(paste(bold("Chronic"), " heart failure")),
            text_pattern = expression(paste("{label}", N, " = ", bold("{n}"), "/{N}: ", italic("{perc}"), "%")),
            text_pattern_exc = expression(paste("{label}", bold("{n}"), "({perc})%")),
            show_exc = TRUE) |>
  fc_draw()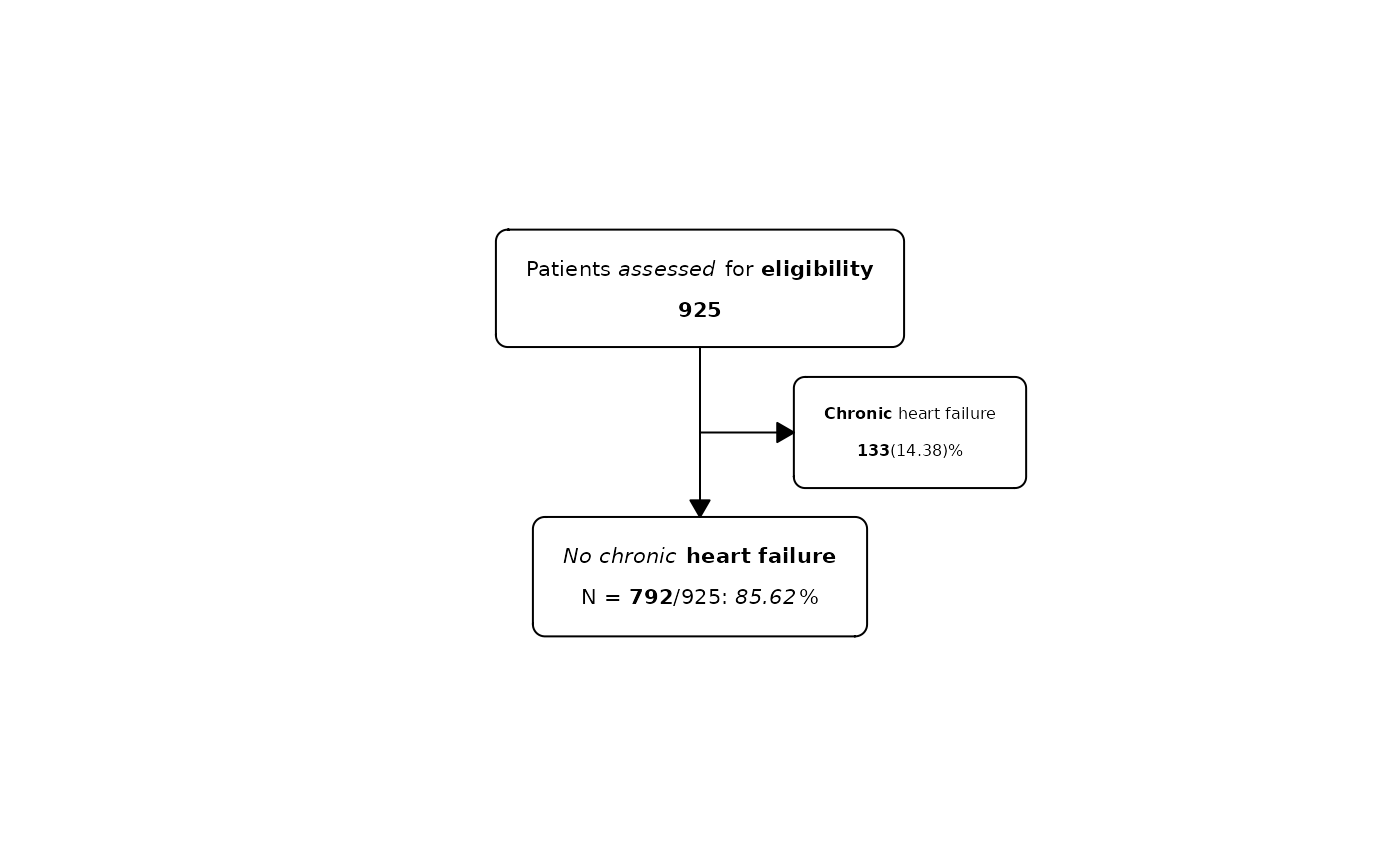
Expressions even allow the use of formulas. For example:
as_fc(N = 500, label = expression(paste(y, " = ", alpha, " + ", beta, x)), text_pattern = expression(paste("{label}", bold("{n}")))) |>
  fc_draw()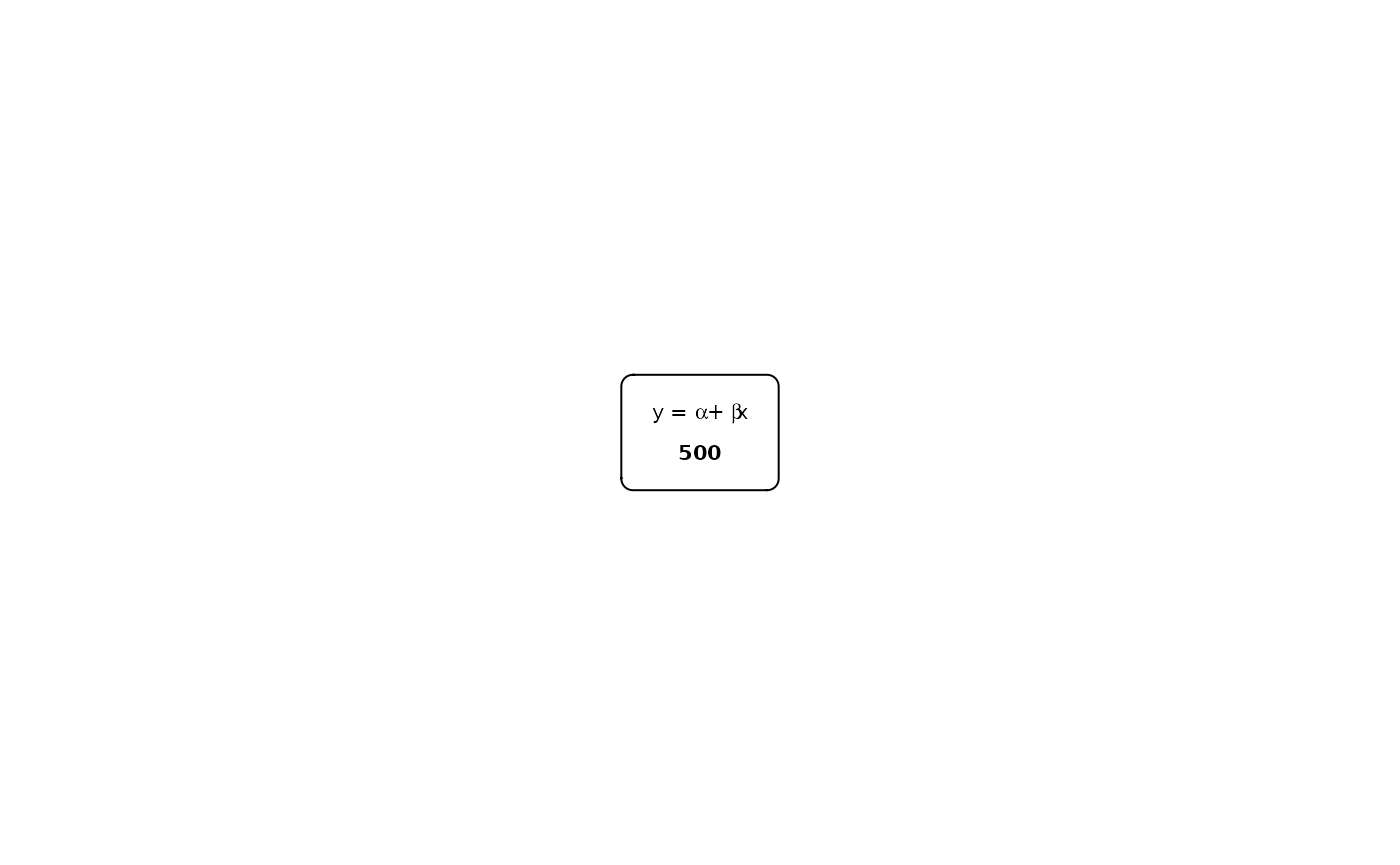
Split in one group
We can perform an additional split only in one of the groups using
the argument sel_group=:
safo |>
  as_fc(label = "Patients assessed for eligibility") |>
  fc_filter(!is.na(group), label = "Randomized", show_exc = TRUE) |>
  fc_split(group) |>
  fc_split(N = c(50, 60), sel_group = "cloxacillin alone") |>
  fc_draw()
## Warning: `object$data` has been grouped by a new variable called `split1_sel_group`,
## because `sel_group` has been used in the split.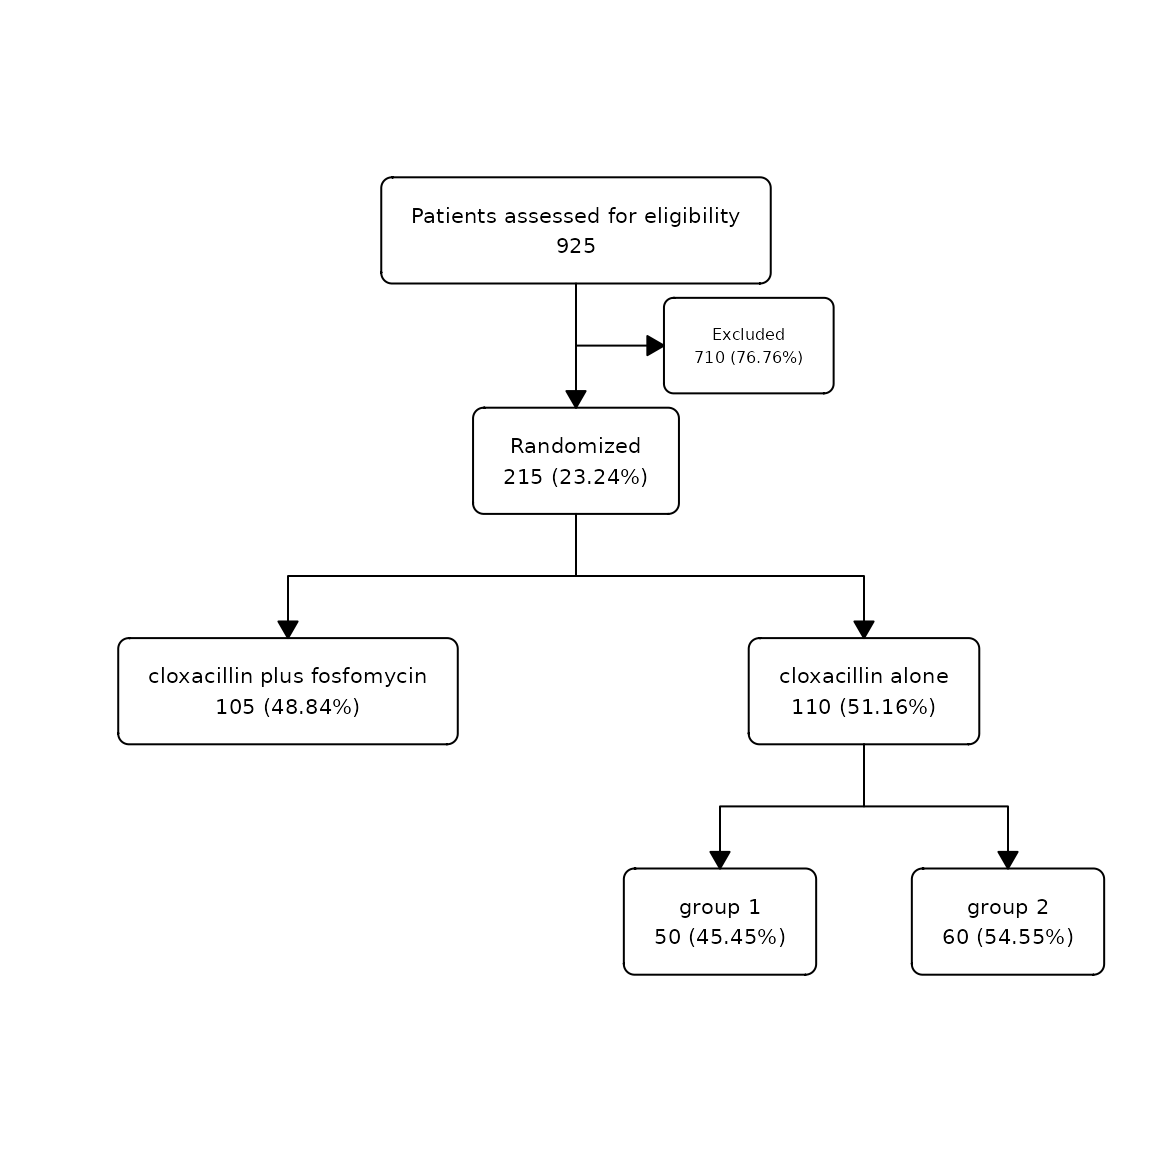
Then, we could also perform a filter in the other group:
safo |>
  as_fc(label = "Patients assessed for eligibility") |>
  fc_filter(!is.na(group), label = "Randomized", show_exc = TRUE) |>
  fc_split(group) |>
  fc_split(N = c(50, 60), sel_group = "cloxacillin alone") |>
  fc_filter(N = 50, sel_group = "cloxacillin plus fosfomycin") |>
  fc_draw()
## Warning: `object$data` has been grouped by a new variable called `split1_sel_group`,
## because `sel_group` has been used in the split.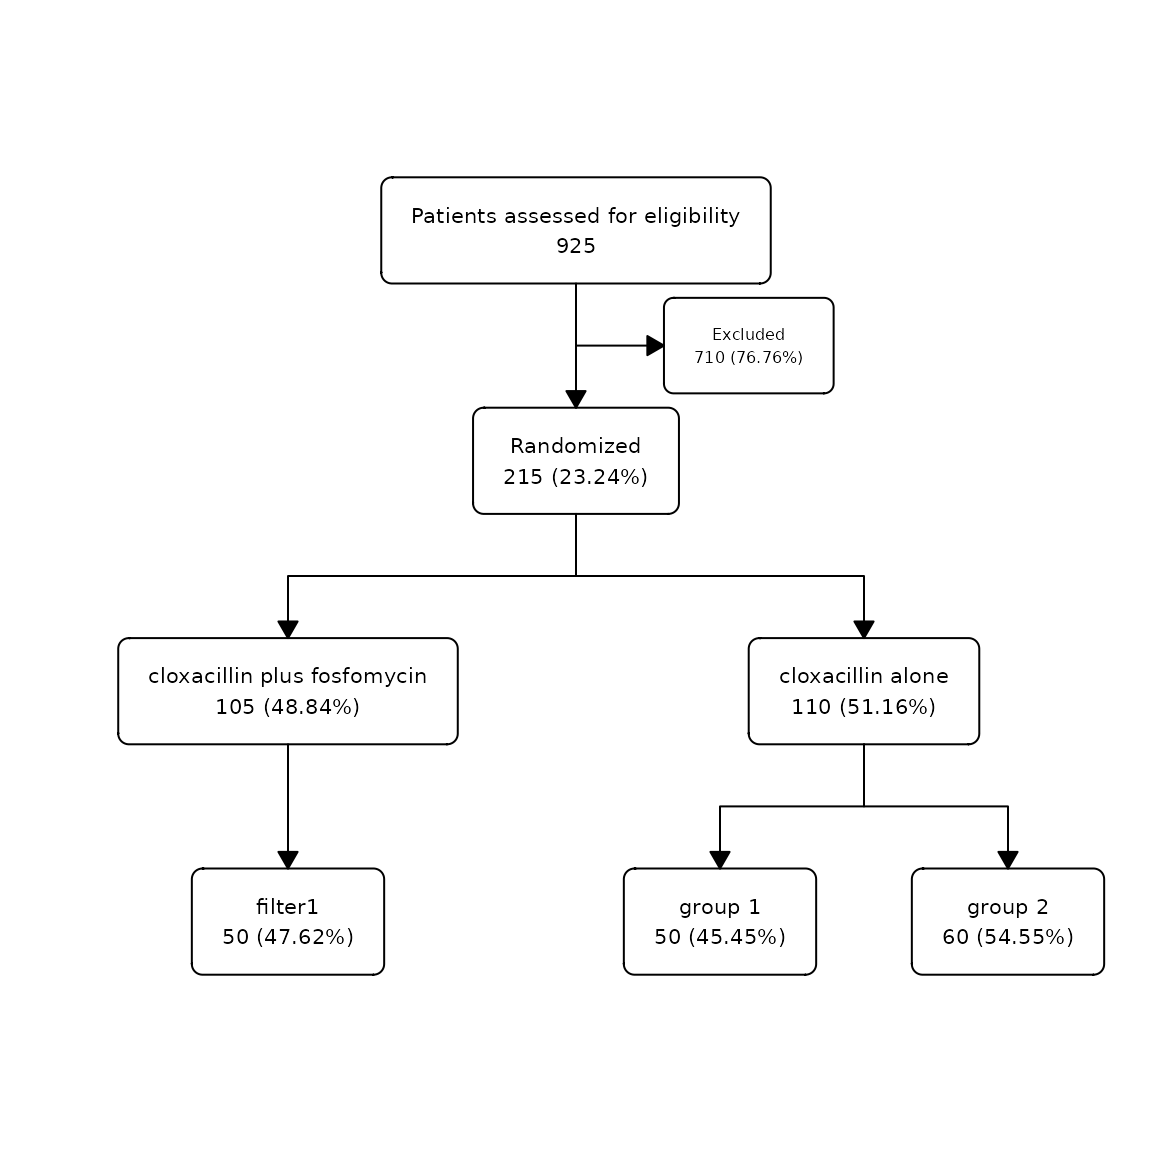
If we want to select a group in a flowchart with more than two groups
we have to supply a vector in sel_group= with the desired
groups to be selected:
safo |>
  as_fc(label = "Patients assessed for eligibility") |>
  fc_filter(!is.na(group), label = "Randomized", show_exc = TRUE) |>
  fc_split(group) |>
  fc_split(N = c(50, 55, 10, 100)) |>
  fc_filter(N = 60, sel_group = c("cloxacillin alone", "group 2")) |>
  fc_draw()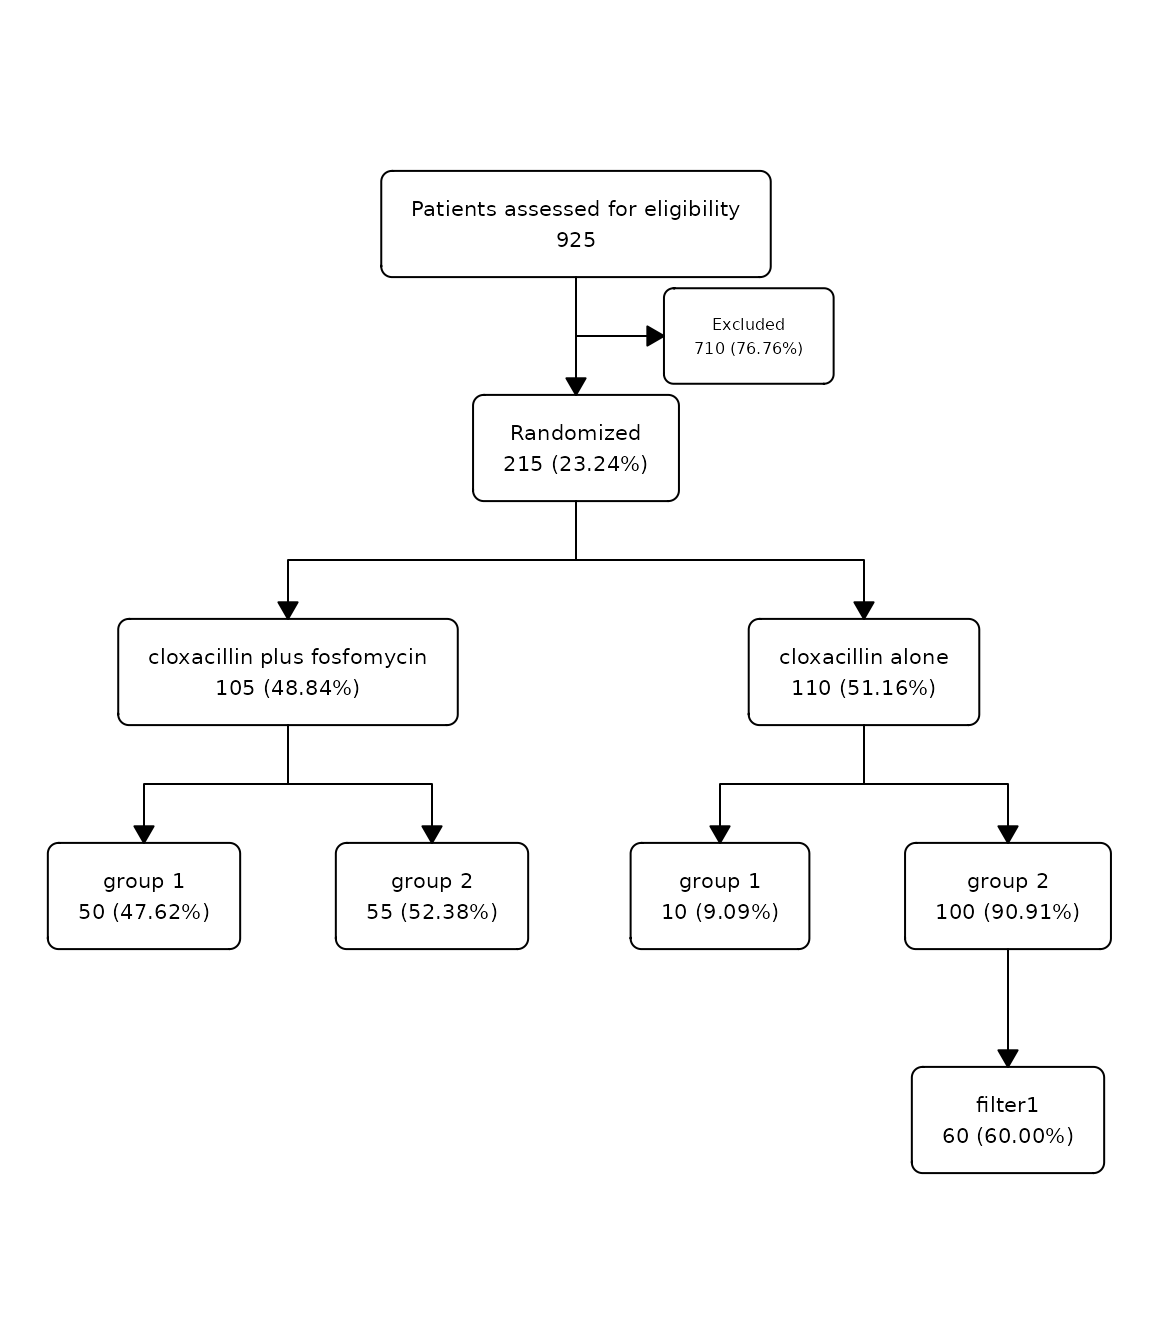
Previous to modifying it, we can use the function
fc_view() to inspect the element $fc that we
want to change:
safo_fc |>
  fc_view("fc")
## # A tibble: 3 × 22
## id x y n N perc label text_pattern text type group just
## <int> <dbl> <dbl> <int> <int> <chr> <chr> <chr> <chr> <chr> <lgl> <chr>
## 1 1 0.5 0.667 925 925 100 Pati… "{label}\n{… "Pat… init NA cent…
## 2 2 0.5 0.333 215 925 23.24 Rand… "{label}\n … "Ran… filt… NA cent…
## 3 3 0.65 0.5 710 925 76.76 Excl… "{label}\n … "Exc… excl… NA cent…
## # ℹ 10 more variables: text_color <chr>, text_fs <dbl>, text_fface <dbl>,
## # text_ffamily <lgl>, text_padding <dbl>, bg_fill <chr>, border_color <chr>,
## # width <lgl>, height <lgl>, end <lgl>Let’s customise the text in the exclusion box (id = 3)
to specify different reasons for exclusion, and change the x
and y coordinate:
safo_fc |>
  fc_modify(
    ~ . |>
      mutate(
        text = ifelse(id == 3, str_glue("- {sum(safo$inclusion_crit == 'Yes')} not met the inclusion criteria\n- {sum(safo$exclusion_crit == 'Yes')} met the exclusion criteria"), text),
        x = case_when(
          id == 3 ~ 0.75,
          TRUE ~ x
        ),
        y = case_when(
          id == 1 ~ 0.8,
          id == 2 ~ 0.2,
          TRUE ~ y
        )
      )
  ) |>
  fc_draw()